Mastering Sensitivity and Specificity for Clinicians

You're probably in a familiar position. A patient's history is concerning, the family has noticed change, and you're looking at a screening result that's been labelled “accurate”. The problem is that “accurate” doesn't tell you what you need at the point of care. It doesn't tell you whether the test is good at catching subtle disease, whether it creates too many false alarms, or whether a negative result is strong enough to let you pause and watch rather than escalate.
That's why sensitivity and specificity matter so much in cognitive health. They aren't abstract exam concepts. They shape whether you reassure, refer, repeat testing, adapt the protocol, or question the tool itself. In memory clinics, rehabilitation settings, primary care, and neuropsychiatry, these metrics influence real decisions for real people.
Clinicians often know the definitions but still get tripped up in practice. The usual sticking points are predictable. People mix up sensitivity with predictive value. They assume one “good” number means the test is good in every setting. They forget that patient factors such as visual impairment can change how a cognitive screener behaves. Those are the errors that often result in missed cases or unnecessary referrals.
Why Sensitivity and Specificity Matter in Clinical Practice
A common scenario goes like this. You're assessing an older adult with mild forgetfulness, reduced confidence, and a family report that “something is off”. The screen is meant to help you decide whether further work-up is warranted. If that tool misses disease, you delay care. If it overcalls disease, you create anxiety, consume specialist time, and may send the patient down a path they didn't need.
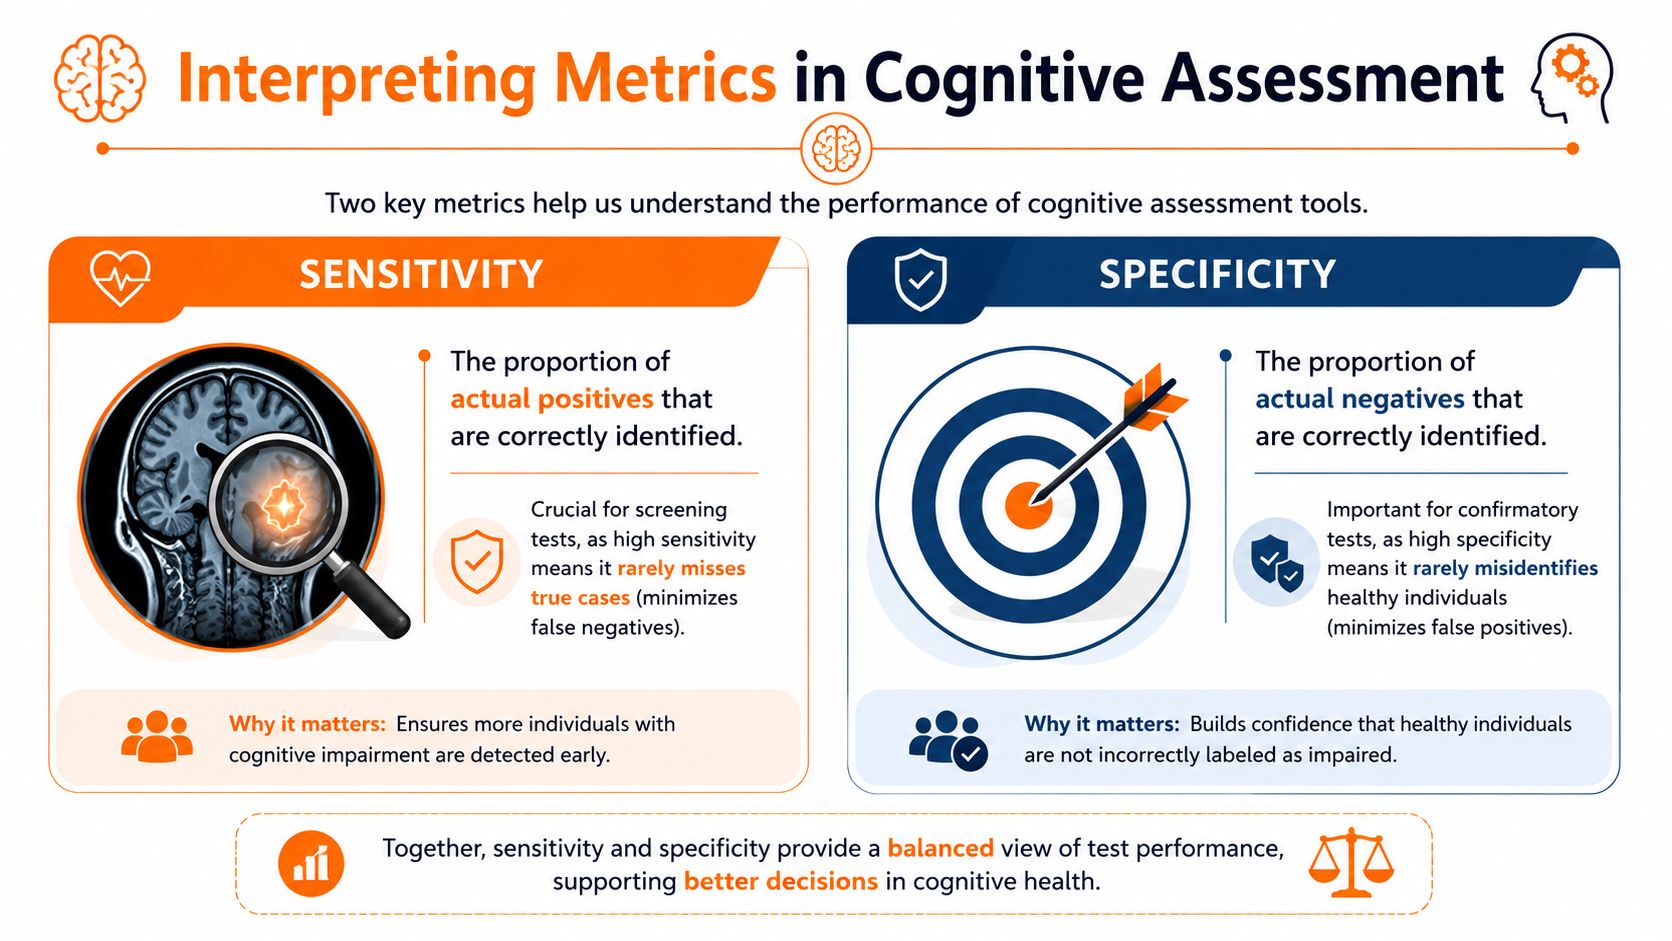
That's the clinical value of sensitivity and specificity. They tell you how a test behaves under pressure. Sensitivity tells you how well the test catches people who have the condition. Specificity tells you how well it avoids labelling healthy people as abnormal.
A cognitive screening example
The Montreal Cognitive Assessment, or MoCA, demonstrates 83% sensitivity and 82% specificity at a cutoff value of 21 for detecting mild dementia, with a negative predictive value of 94% according to a MoCA performance study in mild dementia. In practice, that means a score above that threshold can be especially useful when you're trying to rule out dementia rather than rely on hunches alone.
If you work with families who ask what a cognitive screen is measuring, a clear primer on what cognitive assessment means in practice can help frame that conversation before you even interpret the numbers.
Clinical lens: A test result only becomes useful when you know what kind of mistake the test is most likely to make.
What these metrics change at the bedside
They change how you use a tool, not just whether you like it.
For screening: You want a tool that misses as few true cases as possible.
For confirmation: You want a tool that produces as few false positives as possible.
For follow-up planning: You need to know whether a negative result gives enough reassurance to defer more invasive or resource-heavy evaluation.
For patient counselling: You need language that translates a statistic into a practical next step.
A clinician who understands sensitivity and specificity reads a test report differently. Instead of asking, “Is this test good?” they ask, “Good for what decision, in which patient, under what conditions?” That's the question that protects patients from both overconfidence and underdiagnosis.
Defining Sensitivity and Specificity with a 2x2 Table
A 2x2 table helps turn a fuzzy question, “How good is this test?” into something you can use in clinic. In cognitive care, that matters because the error is rarely abstract. A false negative can delay workup for a patient whose family has already noticed decline. A false positive can send someone with poor vision, low literacy, or anxiety down an unnecessary dementia pathway.

The four cells that matter
The table crosses two realities. What the test says, and what is true.
The 2x2 Confusion Matrix | Condition Present | Condition Absent |
|---|---|---|
Test Positive | True Positive | False Positive |
Test Negative | False Negative | True Negative |
Here's the plain-language version:
True positive: The patient has the condition, and the test correctly flags it.
False positive: The patient does not have the condition, but the test flags it anyway.
False negative: The patient has the condition, but the test misses it.
True negative: The patient does not have the condition, and the test correctly clears it.
Clinicians often mix up accuracy and consistency here. A tool can give similar results from one administration to the next and still be wrong in a predictable direction. That distinction matters if fatigue, hearing loss, education level, or visual impairment are affecting performance. It is the same reason test-retest reliability in clinical measurement belongs in the same conversation, even though reliability and diagnostic accuracy answer different questions.
The formulas
Once the cells are clear, the formulas become easier to remember because each one asks a different clinical question.
Sensitivity = True Positives / All patients who have the condition
Specificity = True Negatives / All patients who do not have the condition
Sensitivity asks, “Of the people who have cognitive impairment, how many did this test catch?”
Specificity asks, “Of the people who do not have cognitive impairment, how many did this test correctly leave alone?”
A missed case lowers sensitivity. A false alarm lowers specificity.
A worked clinical example
Say you are reviewing a memory screen in a referral clinic. Some patients have impairment after full evaluation. Others do not. The 2x2 table lets you sort every result into one of the four cells above and then calculate two different strengths of the test.
If the test misses many patients who have early dementia, sensitivity drops. That is a problem in screening, where the main job is to catch cases that deserve a closer look.
If the test wrongly labels many unaffected patients as impaired, specificity drops. In cognitive practice, that can happen for reasons that have little to do with neurodegeneration, such as visual problems interfering with visuospatial items, language barriers, or low familiarity with test-taking. A positive score in that setting is not meaningless, but it needs context.
That is also why family observations still matter. A normal screen in someone with clear functional decline reported by relatives should make you reconsider the whole picture, not just accept the paper score. Practical descriptions from the Family Caregiving Kit on cognitive signs can be useful when you are comparing a formal test result with what families are seeing day to day.
Why clinicians mix these up
The denominator causes most of the confusion.
Sensitivity uses only the patients who have the condition.
Specificity uses only the patients who do not have the condition.
So these numbers do not answer, “What is the chance my patient with a positive test really has dementia?” They describe how the test performed against the truth in each subgroup.
That difference matters more than many textbook explanations suggest. In real cognitive assessment, patient factors can change how you interpret an apparent false positive or false negative. A patient with macular degeneration may underperform on visually loaded tasks. A patient with high education may compensate well enough to score in the normal range despite early decline. The table stays the same. Your interpretation of why a result landed in a given cell becomes more careful.
How to Interpret These Metrics in Cognitive Assessment
A patient scores in the normal range on a brief screen. His daughter describes unpaid bills, repeated stories, and getting lost on a familiar route. Another patient screens positive, yet the main barrier turns out to be poor vision and difficulty seeing the test materials clearly. Sensitivity and specificity start to make sense when you use them to answer one practical question: what should this result make me do next?
Use SNOUT and SPIN as bedside shortcuts, not final answers
These two memory aids are still useful in clinic.
SNOUT: A highly sensitive test, when negative, helps rule out disease.
SPIN: A highly specific test, when positive, helps rule in disease.
They work like screening gates. A sensitive gate is built to catch as many true cases as possible, so a negative result is reassuring. A specific gate is built to avoid falsely labeling healthy people, so a positive result carries more weight.
The catch is that cognitive screening rarely happens under ideal conditions. Vision loss, hearing difficulty, anxiety, low literacy, limited English proficiency, sleep deprivation, and cultural unfamiliarity with testing can all change how a person performs. That means the same metric can support different decisions depending on the patient in front of you.
Match the metric to the clinical job
In cognitive care, the test is rarely the endpoint. It helps you decide whether to reassure, monitor, repeat testing under better conditions, or move to a fuller workup.
If the main concern is missing early impairment in a patient with a convincing history, sensitivity deserves more attention. A negative result on a more sensitive tool lowers concern, but it does not erase a strong collateral history or functional decline.
If the main concern is avoiding unnecessary referrals in someone with vague symptoms and low pretest concern, specificity becomes more important. A positive result on a more specific tool gives you firmer ground for further evaluation. Tool-selection comparisons such as MoCA vs MMSE in clinical use can help you choose an instrument that fits the setting and the question.
A more realistic dementia screening scenario
Consider two patients.
The first is a retired accountant with subtle errors in finances, repeated questions, and a spouse who is clearly worried. Here, a negative screen on a test chosen for sensitivity may reduce the probability of significant impairment, but it should not stop the assessment if the history still points to decline. High baseline cognitive reserve can mask early disease.
The second is an older adult with glaucoma, limited formal education, and high anxiety about testing. A positive result may reflect true impairment, but it may also reflect the way the test was administered and the demands the test places on vision, speed, and familiarity with paper-based tasks. In that situation, specificity on paper does not save you from a context problem.
That is why clinicians should read test performance numbers as guides to error patterns, not as guarantees about an individual patient.
What to say after the result
Good interpretation links the result to the next clinical step.
Negative screen on a highly sensitive tool: “This makes significant impairment less likely, but I still need to weigh your history, function, and any family concerns.”
Positive screen on a highly specific tool: “This result strengthens the case for further evaluation.”
Borderline score with sensory or language barriers: “I am cautious about overinterpreting this score. We may need a different format or a broader assessment.”
Normal score with clear day-to-day decline: “The screen does not fully match the history, so I would not stop here.”
Family reports often clarify whether a result fits real life. The Family Caregiving Kit on cognitive signs is useful for framing the functional changes families notice before a diagnosis is ever made.
The practical lesson is simple. Sensitivity and specificity tell you how a test tends to behave. Clinical interpretation comes from combining those tendencies with the patient's history, functional change, education, language, and sensory limitations.
Understanding Predictive Values and the Impact of Prevalence
This is the point where many good clinicians start to mistrust a perfectly respectable test. They see acceptable sensitivity and specificity on paper, then experience too many false alarms in practice. The missing piece is usually prevalence.
Predictive values answer the patient's question
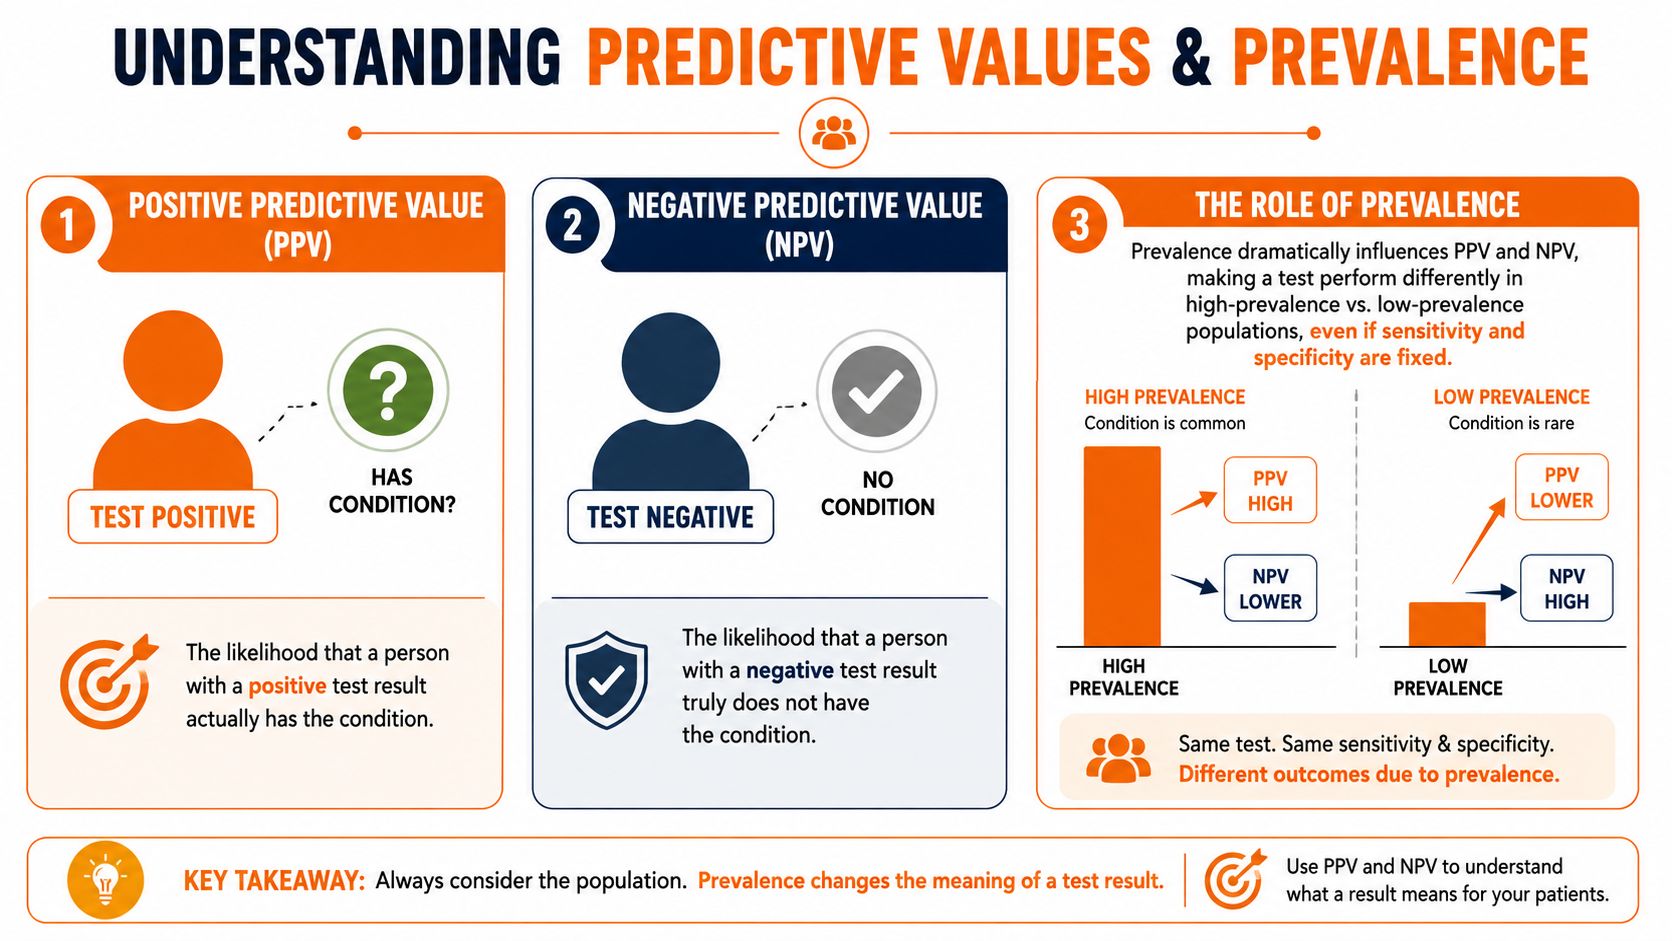
Patients don't ask, “What proportion of diseased patients test positive?” They ask, “If I tested positive, do I have it?”
That's positive predictive value, or PPV.
They also ask, “If I tested negative, can I stop worrying?”
That's negative predictive value, or NPV.
The critical difference is this: predictive values depend heavily on how common the condition is in the population being tested. Sensitivity and specificity don't shift in the same way because they are properties of the test relative to true disease status.
Why a positive result can be less useful than it looks
A strong example comes from the Mini-Cog. It has a reported sensitivity range of 76% to 100%, yet its positive predictive value is under 50% and its specificity ranges from 27% to 85% according to the AAFP discussion of Mini-Cog clinical utility. That combination creates a practical problem. A positive result may send many non-dementia patients into specialist referral pathways.
That's not a trivial inconvenience. It affects clinic flow, specialist access, patient anxiety, and how much confidence primary care teams place in the screener.
What prevalence changes in daily practice
A memory clinic and a general community screening event are not the same environment.
In a higher-prevalence setting, a positive result tends to mean more because disease is more common among those being tested. In a lower-prevalence setting, the same test may produce many more false positives relative to true positives. That's why one tool can feel clinically useful in one service and frustrating in another.
If you're reviewing options for cognitive screening tests used for dementia pathways, this is one of the first questions to ask: who exactly is being screened?
A simple way to avoid misreading results
Before acting on a screen, run through three questions:
Who was this tool validated in?
A memory clinic sample may not reflect your patient population.What is the likely prevalence in my setting?
The answer changes how much weight you should give to a positive or negative result.What decision am I making with this test?
Screening, referral triage, and diagnostic confirmation require different balances.
A test can be good at detecting disease and still be poor at telling you whether a positive patient actually has it in your clinic.
That distinction saves time and prevents overconfidence. It also explains why two clinicians can use the same tool and have very different experiences with it.
Avoiding Common Pitfalls in Test Interpretation
The most costly errors in test interpretation usually don't come from bad arithmetic. They come from using a test as though every patient were interchangeable with the validation sample.
In cognitive assessment, that assumption fails quickly. Performance can shift because of language, education, fatigue, anxiety, motor limitations, hearing loss, or vision. When clinicians treat a score as pure cognition without checking those factors, they risk misclassifying the patient.
The visual impairment problem
One of the clearest examples involves visual impairment and the MoCA. Data show that MoCA sensitivity for Mild Cognitive Impairment drops from 90% to 44% when visual items are removed or left unadjusted for visually impaired populations according to the study on visual impairment and MoCA sensitivity. That's not a minor technical issue. It means a large number of true cases may be missed.
In practice, this can happen subtly. The patient struggles with drawing, copying, scanning, or visually mediated tasks. The score looks reassuring enough. The clinician moves on, not realising the tool's sensitivity has been sharply reduced in that context.
What this looks like in clinic
A patient with low vision may underperform on visually loaded tasks for reasons unrelated to core memory or executive decline. Another patient may have enough compensatory skill to produce a superficially “acceptable” result despite clinically meaningful change. In both directions, unadjusted interpretation can mislead.
The lesson isn't that the screener is useless. The lesson is that the metric belongs to the testing conditions. Change the conditions enough, and the published performance no longer applies in the same way.
Practical safeguards
Use a short pre-test check before you trust the score.
Check sensory access: Ask whether the patient can clearly see test materials, hear instructions, and manage any motor demands.
Review task load: Identify which items depend heavily on vision, speed, graphomotor function, or language.
Interpret with context: If a patient factor plausibly distorted performance, document it and lower your confidence in the score as a standalone result.
Adapt next steps: Consider modified assessment, repeat testing under better conditions, collateral history, or referral for more thorough evaluation.
Don't ask a score to answer a question the testing conditions made impossible to measure well.
The broader principle
This pitfall extends well beyond vision. Any time the patient differs meaningfully from the validation population, you should assume the published sensitivity and specificity may not transfer cleanly. The result still has value, but only when interpreted as one data point inside a broader clinical picture.
Using ROC Curves to Find the Optimal Balance
Sensitivity and specificity move in opposite directions when you change a cutoff. Tighten the threshold and you often gain specificity while losing sensitivity. Loosen it and you usually catch more cases while accepting more false positives. The ROC curve is the visual tool that helps you manage that trade-off.

How to read the graph
On an ROC curve:
The y-axis is sensitivity, also called the true positive rate.
The x-axis is 1 - specificity, also called the false positive rate.
Each point on the curve represents a different cutoff. You're not looking for a magic number in isolation. You're choosing a threshold that fits the clinical goal.
Why the best cutoff depends on the decision
A presurgical epilepsy work-up shows this clearly. In EEG-fMRI for epilepsy, a Z-score threshold of 3.5 yields 62% sensitivity and 100% specificity for localising the origin zone according to the Frontiers in Neurology study on threshold selection in EEG-fMRI. That threshold was valuable because the clinical team prioritised avoiding false-positive localisation before surgery.
That's the whole point of ROC thinking. The “best” threshold isn't universal. It depends on what mistake you can least afford.
Applying ROC logic to cognitive work
For a broad cognitive screener, you might choose one cutoff for community screening and a different one for specialist confirmation. In the first case, you may accept more false positives to avoid missed cases. In the second, you may want stronger specificity before escalating the diagnostic pathway.
A quick way to use ROC reasoning in practice:
If the cost of a missed case is high, favour sensitivity.
If the cost of a false positive is high, favour specificity.
If both matter, look for the threshold that gives the most acceptable compromise for your workflow and patient population.
ROC curves don't remove uncertainty. They help you choose your uncertainty deliberately.
Enhancing Decision Support with Objective Cognitive Data
A patient reports new forgetfulness after a stroke. Their daughter describes a steep decline, but the patient also has poor vision, low mood, and severe fatigue. In that moment, the question is not whether a cognitive test is "good." The question is whether the result will help you make a sound decision despite factors that can distort performance.
Why objective data changes the conversation
Objective cognitive data gives the clinical discussion a firmer footing when the history is messy or the presentation has several possible explanations. That matters in cognitive care because poor performance can reflect true decline, but it can also reflect visual impairment, hearing difficulty, slowed processing after illness, limited education, language differences, pain, or anxiety during testing. If those factors are not considered, clinicians can overcall impairment or miss it.
Standardised measurement works like a calibrated blood pressure cuff. It does not replace judgement. It makes judgement more consistent.
A useful parallel comes from prognostication after cardiac arrest. A Neurofilament light threshold of 1361 pg/mL shows 68% sensitivity and 98% specificity for predicting unfavourable outcomes according to the JAMA Neurology report on Nf-L prognostication. The lesson for cognitive assessment is practical. A test becomes more useful when clinicians understand what kind of error it is more likely to make and how patient factors may shift that balance in the world.
What stronger decision support looks like
Structured cognitive data improves decisions in ways that matter on a busy clinic day.
If a patient with glaucoma performs poorly on a visually loaded task, that result should not carry the same meaning as poor performance on a task with minimal visual demand. If a patient with depression shows slowed responses but preserved accuracy, that pattern may point you in a different direction than diffuse inaccuracy across several domains. Numbers alone do not solve the case. Patterns, context, and test design do.
Clinicians looking for cognitive assessment tools for structured decision support usually need three things:
Clearer baselines: Structured profiles help separate longstanding weakness from possible recent change.
Better triage: Results can support the decision to monitor, investigate further, or refer for fuller assessment.
More meaningful follow-up: Repeat testing is easier to interpret when the starting point is standardised across domains.
The real gain for clinicians
The main benefit is consistency. Two clinicians reviewing the same objective profile are more likely to frame the problem similarly, explain uncertainty more clearly, and make more reproducible decisions across visits and teams.
That is especially helpful in cognitive health, where families often want a simple answer, yet the answer is conditional. A result may suggest impairment, but only after accounting for visual limitations. A score may look reassuring, but still miss a subtle decline in a highly educated patient with strong baseline function. Sensitivity and specificity matter here because they shape how much confidence you place in the result, and how cautiously you should act on it.
Tools that standardise measurement and present results in a clinically usable way can strengthen screening, follow-up, and care planning without reducing the patient to a single score.

Orange Neurosciences' Cognitive Skills Assessments (CSA) are intended as an aid for assessing the cognitive well-being of an individual. In a clinical setting, the CSA results (when interpreted by a qualified healthcare provider) may be used as an aid in determining whether further cognitive evaluation is needed. Orange Neurosciences' brain training programs are designed to promote and encourage overall cognitive health. Orange Neurosciences does not offer any medical diagnosis or treatment of any medical disease or condition. Orange Neurosciences products may also be used for research purposes for any range of cognition-related assessments. If used for research purposes, all use of the product must comply with the appropriate human subjects' procedures as they exist within the researcher's institution and will be the researcher's responsibility. All such human subject protections shall be under the provisions of all applicable sections of the Code of Federal Regulations.


© 2026 by Orange Neurosciences Corporation