Sensory Profile Dunn Guide for Clinicians
Apr 13, 2026
A parent hands you a crumpled school note at the end of a long clinic day. Their ten-year-old covered his ears during assembly, refused art because of glue on his hands, then melted down when the class changed rooms. The school has called it behaviour. The family says it happens at home too. You can already feel the familiar clinical fork in the road. Is this anxiety, autism, attention difficulty, a sensory pattern, or some mix of all of them?
That’s where sensory profile dunn becomes useful. It gives clinicians a way to stop arguing about whether a child is “too sensitive” or “seeking attention” and start describing how the nervous system and behaviour work together in daily life.
Dunn’s framework helps us ask better questions. Does this person notice input quickly or slowly? Do they let it happen, or do they act to change it? Those two questions sound simple, but they often reveal a much clearer picture than a loose checklist of likes and dislikes.
For clinicians, that shift matters. Instead of writing “avoids noisy spaces”, you can connect the pattern to threshold, participation, and intervention. Instead of guessing whether a student needs calming, alerting, more structure, or less demand, you can build a more defensible plan.
Introduction to Sensory Profile Dunn
A child who panics in the lunchroom and another child who never seems to notice their name being called might both be described as having “sensory issues”. That phrase is common. It’s also too blunt to guide treatment.
Sensory Profile Dunn gives those observations a structure. It helps you sort everyday behaviours into patterns that reflect neurological threshold and self-regulation style. In practice, that means you can move from vague descriptions to clinically useful interpretation.
Consider a school-aged client who gags at cafeteria smells, avoids socks with seams, and becomes agitated when chairs scrape across the floor. A standard behaviour form may capture distress. It may even flag school refusal or emotional dysregulation. But it won’t necessarily tell you why the environment is so hard for that child to manage.
Dunn’s model gives you language for that problem. It helps you see when the issue is likely tied to rapid noticing of sensory events, when the child actively tries to escape them, and how that pattern interferes with participation.
Sensory assessment works best when behaviour is treated as information, not defiance.
Clinicians often get stuck because sensory behaviours can look contradictory. A child may avoid busy settings but also crash into furniture. An adult may say they hate noise but still seek intense movement. Dunn’s model makes room for that complexity without turning the profile into guesswork.
That’s why this framework has stayed relevant across paediatrics, mental health, rehabilitation, and adult practice. It doesn’t reduce people to one trait. It helps you understand the fit, or mismatch, between a person and the sensory demands of everyday life.
Background of Dunn’s Sensory Processing Model
Dr. Winnie Dunn’s model rests on two core ideas. First, people differ in how much input they need before they notice or respond. Second, people differ in what they do when sensory input reaches them.
Those two ideas create the structure behind the whole profile.
The two axes that matter
Think of neurological threshold as a volume setting in the nervous system.
High threshold means it takes more input for the person to notice what’s happening.
Low threshold means the person notices input quickly, sometimes before anyone else in the room seems bothered.
Now think of self-regulation as the person’s response style.
Passive response means they tend to let sensory experiences happen and react after the fact.
Active response means they do something to manage the input, increase it, reduce it, escape it, or control it.
When you cross those two axes, you get four familiar quadrants.
Quadrant | Threshold | Response style | Common clinical picture |
|---|---|---|---|
Low Registration | High | Passive | Misses cues, seems slow to notice |
Sensation Seeking | High | Active | Adds movement, noise, touch, novelty |
Sensory Sensitivity | Low | Passive | Notices everything, gets distracted or overwhelmed |
Sensation Avoiding | Low | Active | Limits input, withdraws, controls routines |
A plain-language way to explain it
I often tell trainees to picture a home thermostat.
A low-threshold system is like a thermostat that clicks on with the slightest change. The room shifts a bit, and the system reacts. A high-threshold system needs a much bigger change before anything happens.
Then add behaviour. One person notices discomfort but doesn’t change much. Another starts adjusting lights, closing doors, pacing, humming, or leaving the room. Same sensory world. Different threshold. Different strategy.
If you want a parent-friendly explainer before introducing Dunn’s framework in clinic, this overview of what is sensory integration is a helpful companion because it puts sensory processing into everyday language.
What each quadrant looks like in real life
Low Registration often confuses adults around the client. The child doesn’t line up when others move. The teen misses social cues. The adult forgets they’re hungry until they’re shaky. It can look like inattention, low motivation, or poor compliance.
Sensation Seeking is easier to spot. This is the child who jumps, chews, spins, taps, crashes, or makes every task bigger and louder. In adults, it may show up as a preference for strong flavours, busy environments, constant movement, or multitasking.
Sensory Sensitivity tends to show up as noticing too much. The person hears the fluorescent buzz, feels the clothing tag, reacts to smell, and struggles to filter out background input. They may not actively escape. They may become tense, distracted, tearful, or irritable.
Sensation Avoiding looks more organised on the surface. These clients often create rules to protect themselves. Same cup. Same route. Same seat. Limited foods. Controlled lighting. Fast exits.
A lot of clinicians run into diagnostic confusion here. Sensory patterns can overlap with autism, ADHD, anxiety, trauma, and learning differences. This discussion of autism (ASD) or sensory processing disorder (SPD), a diagnostic dilemma-or-sensory-processing-disorder-(spd)-a-diagnostic-dilemma) is useful when your team needs a clearer differential lens.
When you understand the threshold, the behaviour starts making sense.
Structure and Scoring of Sensory Profile Dunn
A parent reports that their child melts down in the grocery store, but the teacher describes the same child as quiet and slow to respond in class. An adult says, "I am fine," yet their work history shows repeated trouble in noisy, fast-changing settings. The value of the Sensory Profile is that it gives those scattered observations a shared structure, so the team is not guessing from one story at a time.
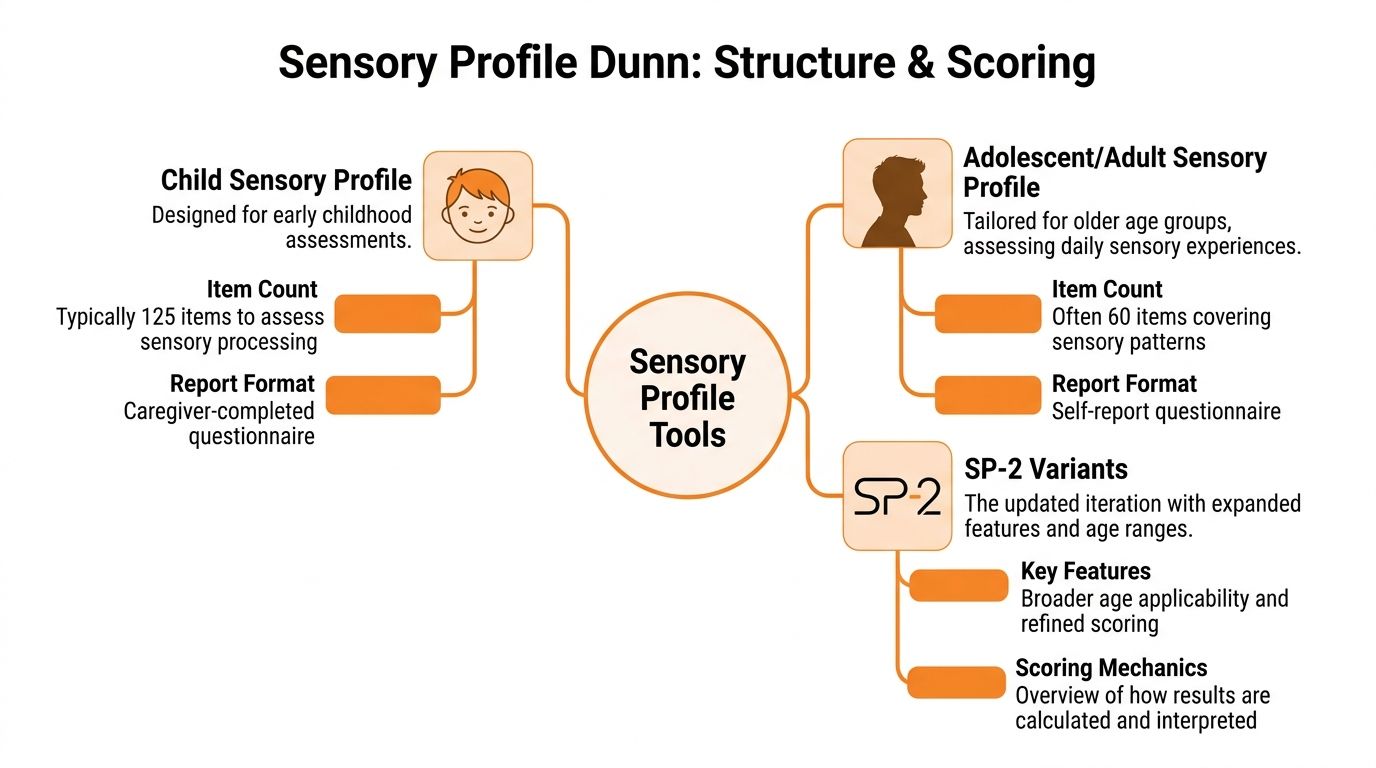
The forms differ by age and by who completes them, but the scoring logic stays stable. You collect ratings about everyday sensory behaviour, sort those ratings into Dunn’s quadrant patterns, total them, and compare the result with the manual’s scoring ranges.
What clinicians are actually scoring
Clinicians often talk about "the sensory profile" as if it were one form. In practice, you are choosing among related tools.
Child versions are usually completed by caregivers or teachers because young children may not describe their own patterns accurately. Adolescent and adult versions rely more on self-report. SP-2 formats widen the age range and give you more respondent options.
That respondent choice matters.
A caregiver report is like watching traffic from the sidewalk. You see what happens across routines, transitions, meals, dressing, school, and community settings. A self-report is more like sitting in the driver’s seat. You learn what the person notices, avoids, seeks, or misses from the inside. If you mix those perspectives without naming the difference, your interpretation can drift.
The AASP as a scoring template
The Adolescent/Adult Sensory Profile shows Dunn’s structure clearly. A published overview describes the AASP as a 60-item self-report measure with 15 items in each quadrant, rated on a 5-point Likert scale, with normative data drawn from U.S. participants aged 11 years and older (PMC overview of the AASP).
Those anchors are more useful than they first appear. They help respondents separate rare events from routine ones. That sounds simple, but it protects scoring quality. Without that frame, one person may mark "sometimes" for a weekly event, while another uses the same rating for something that happens five times a day.
A clean scoring sequence
Scoring goes better when you handle it in the same order every time.
Match the form to the respondent
Use self-report when the person can reflect on their own sensory experience with reasonable consistency. Use observer report when insight, communication, or developmental level limits that accuracy.Scan for missing or inconsistent responses
A skipped item can distort a quadrant total. Catch blanks before you score, not while you are writing the report.Sort items into the correct quadrant totals
Each item feeds one sensory pattern. This step is like balancing four separate buckets. If one item lands in the wrong bucket, the overall pattern can shift.Compare totals with the manual’s interpretive ranges
The score only has meaning in relation to the reference group used by the measure. A raw total by itself does not tell you whether the pattern is common, less common, or much more pronounced than peers.Translate the score into function
Write what the pattern means for dressing, eating, transitions, school output, work tolerance, sleep, driving, or community access. That translation is where assessment becomes clinical reasoning.
Teams building a repeatable intake process often pair sensory measures with a broader framework for assessments in occupational therapy, so scoring decisions stay consistent across clinicians and settings.
Where scoring errors usually start
The biggest mistake is treating the number as the conclusion. The number is the starting point.
A high quadrant score does not automatically mean disorder, and a score in the expected range does not rule out meaningful sensory barriers in a demanding environment. The clinician’s task is to ask, "How does this pattern show up in participation, and under what conditions does it become a problem?"
Another common error is over-reading one vivid item. A client may strongly avoid hair washing, cafeteria noise, or clothing tags and still show a mixed profile overall. Dunn’s model works at the pattern level across routines and contexts. One dramatic example can guide your interview, but it should not replace the full score profile.
Why this matters more in AI-supported workflows
This part of practice is changing. Many clinics no longer review sensory questionnaires in isolation. They compare them with attention data, behaviour ratings, caregiver reports, and cognitive performance patterns gathered in the same assessment pathway.
Orange Neurosciences adds value here because real-time cognitive assessment data can sharpen how you read a sensory score. For example, a low registration pattern paired with slowed response speed and weak cue detection points you toward one kind of support. The same sensory score paired with stronger cognitive efficiency but high environmental stress may lead you somewhere else. The questionnaire still matters, but the interpretation gets more precise when sensory data is read alongside live performance data instead of as a stand-alone snapshot.
That is the practical shift. Dunn’s profile organises behaviour. AI-supported cognitive workflows help clinicians test whether the sensory pattern fits what the person is doing in real time.
Interpreting Sensory Profile Scores for Clinical Insights
A score only becomes useful when it changes what you do next.
Clinicians often receive a profile report and then freeze. They know which quadrant stands out, but they’re not sure how to turn that into goals, environmental changes, or language for families and schools. The fix is to link each score to function, not merely to behaviour.
Turn quadrant scores into participation statements
Start with this question. What does the person’s sensory pattern make harder in daily life?
For example:
Low Registration can affect cue detection, transitions, initiation, and safety awareness.
Seeking can affect seated work, social boundaries, and pacing during structured tasks.
Sensitivity can affect attention, endurance, emotional regulation, and tolerance for busy environments.
Avoiding can affect flexibility, access to settings, willingness to try new activities, and family routines.
That translation step matters because it keeps your report from sounding like a personality description.
Instead of writing “high avoiding”, write something like this in your own clinical language: the client actively limits sensory exposure, particularly in unpredictable environments, which reduces participation in group learning and community outings.
Use patterns, not labels, to explain behaviour
A useful way to explain the profile to caregivers is to pair each pattern with a plain-language description.
Pattern | What the family may see | What the clinician may infer |
|---|---|---|
Low Registration | “He doesn’t seem to notice” | High threshold with passive response |
Seeking | “She’s always on the move” | High threshold with active response |
Sensitivity | “Everything bothers him” | Low threshold with passive response |
Avoiding | “She has to control the setting” | Low threshold with active response |
This is also where evidence helps frame the significance of your findings. In a landmark AJOT study summary, 281 children with ASD aged 5 to 13 were analysed using the Short Sensory Profile, and 95% exhibited some degree of sensory processing dysfunction compared with typically developing peers. The greatest differences were reported in Underresponsive/Seeks Sensation, Auditory Filtering, and Tactile Sensitivity, with 86% scoring more than 1 standard deviation below norms in Seeking behaviours (Short Sensory Profile summary).
That finding matters clinically because it reminds us that mixed profiles are common. A child may seem underresponsive in one domain and highly reactive in another. That isn’t contradictory. It’s often the pattern.
A simple interpretation formula
When you’re writing up results, try this sequence:
Name the pattern
Describe the daily behaviours that match it
Identify the participation cost
Tie the plan to the pattern
Here’s a short example.
Pattern
Heightened sensitivity with associated avoiding behaviours.Daily behaviour
Distress with classroom noise, strong reactions to tactile input, and reduced tolerance for crowded spaces.Participation cost
Difficulty sustaining attention during group instruction and reduced access to shared activities.Treatment link
Environmental modification, graded exposure, predictable transitions, and coaching for early self-advocacy.
That structure works in reports, team meetings, and family feedback sessions.
If the score doesn’t change your recommendation, you probably haven’t interpreted it deeply enough.
Watch for overstatement
The profile is not a diagnosis. It doesn’t tell you why a person has a pattern. It tells you how sensory processing may be affecting day-to-day function.
That distinction protects you from overreaching. It also helps in multidisciplinary settings, where sensory findings need to sit beside speech, psychology, developmental, and educational data rather than replace them.
Administration Tips and Common Pitfalls
Good sensory data starts before the first item is answered.
Most administration problems don’t come from the tool itself. They come from rushed instructions, unclear examples, and respondents trying to answer from memory after a stressful week.
Set up the respondent for accurate answers
If a caregiver is completing the form, tell them you’re looking for typical frequency across real routines, not their worst day and not the day they wish they had.
That small instruction changes everything. Otherwise, many families answer based on the most dramatic event they can remember.
A few habits improve quality right away:
Anchor to settings: Ask them to think through home, school, car, community, meals, dressing, and bedtime.
Use recent routines: Current patterns are easier to rate accurately than older phases.
Clarify frequency words: “Often” and “sometimes” mean different things to different people unless you tie them to observable routine frequency.
Common errors that distort scores
Here are the mistakes I see most often in training clinics.
Answering from emotion instead of observation
A parent under stress may rate every challenging item at the top end. Slow the process down and ask for examples.Confusing preference with dysfunction
Loving strong flavours or disliking certain fabrics doesn’t automatically indicate a clinically important sensory issue. Look for impact on participation.Ignoring context
A child who avoids noise only in chaotic, unpredictable settings may present very differently in structured spaces.Overhelping the respondent
Explaining items is fine. Leading the answer isn’t. If you paraphrase too aggressively, you may change the construct being measured.
A quick administration checklist
Before scoring | What to check |
|---|---|
Respondent fit | Is this the best person to report? |
Item completion | Are there blank or double-marked items? |
Time frame | Were answers based on current routines? |
Context | Did the respondent consider multiple settings? |
Language clarity | Were misunderstood items clarified neutrally? |
A useful parallel is found in structured screening tools outside sensory work. This page on instructions for MoCA is a good reminder that standardised assessment only stays useful when administration stays consistent.
What to say when families ask for the “right” answer
They often do. Especially when they fear the school, insurer, or physician will judge them.
My usual response is simple. There isn’t a perfect answer. There’s only the most accurate picture of everyday life. That lowers pressure and improves honesty.
“Rate what usually happens, not what should happen.”
That one sentence often rescues the validity of the whole profile.
Research Evidence and Practical Examples
The research behind Dunn’s tools matters most when it sharpens your clinical judgement. It shouldn’t sit in the report as decoration.
One of the strongest examples comes from the Sensory Profile 2. In the verified summary, 95% of children with ASD in school-age groups aged 3 to 14 showed atypical sensory processing patterns, with the highest effect sizes in Sensory Sensitivity and Low Registration, and those atypical patterns were reflected in scores falling below the 7th percentile compared with typically developing peers (SP-2 Canadian infographic summary).
That finding has practical weight. It tells us not to dismiss passive patterns just because they draw less attention than overt avoidance or dramatic seeking.
What the evidence suggests in clinic
A child with high sensitivity may not always run from input. Sometimes they sit in the room and slowly fall apart. They stop listening, become rigid, or appear oppositional. The profile helps you see that this may be sensory load, not non-compliance.
A child with low registration may be misread in the opposite direction. Adults may assume they’re not trying, but the sensory cue never landed strongly enough to prompt action.
That distinction changes intervention planning.
For sensitivity, clinicians often lean on environmental reduction, predictable routines, and carefully graded exposure.
For low registration, they often need clearer cues, stronger salience, repeated prompts, and active engagement strategies.
For mixed patterns, treatment often alternates between support for noticing and support for tolerating.
A brief evidence table
Because only limited quantitative details are verified for this section, the table below includes only those values.
Quadrant | Effect Size (d) | Prevalence (%) |
|---|---|---|
Sensory Sensitivity | Not specified in the verified summary | 95 of children with ASD in the cited school-age SP-2 group showed atypical sensory processing patterns overall |
Low Registration | Not specified in the verified summary | 95 of children with ASD in the cited school-age SP-2 group showed atypical sensory processing patterns overall |
Practical examples you can use tomorrow
Preschool classroom example
A child covers their ears during clean-up, cries when paint touches their fingers, and won’t join circle after the room gets noisy. If the profile points toward sensitivity, your plan might prioritise advance warning, quieter transitions, tactile choice, and a recovery routine before group participation.
Primary school example
A student misses verbal directions, drifts during line-up, and seems unaware of backpack straps slipping off one shoulder. If the profile points toward low registration, intervention may focus on visual cues, movement before seated work, and stronger environmental signals.
Adult rehabilitation example
An adult recovering in a busy outpatient setting reports exhaustion after open-gym sessions and struggles with executive tasks when surrounded by movement and touch. Even before you tie in broader cognitive data, the sensory pattern can guide room selection, scheduling, and task pacing.
For clinicians who like quick-access summaries to support decision-making, these clinical knowledge summaries can be useful alongside your formal sensory interpretation.
Research is most helpful when it tells you what to change on Monday morning.
Use Cases Across the Lifespan and Settings
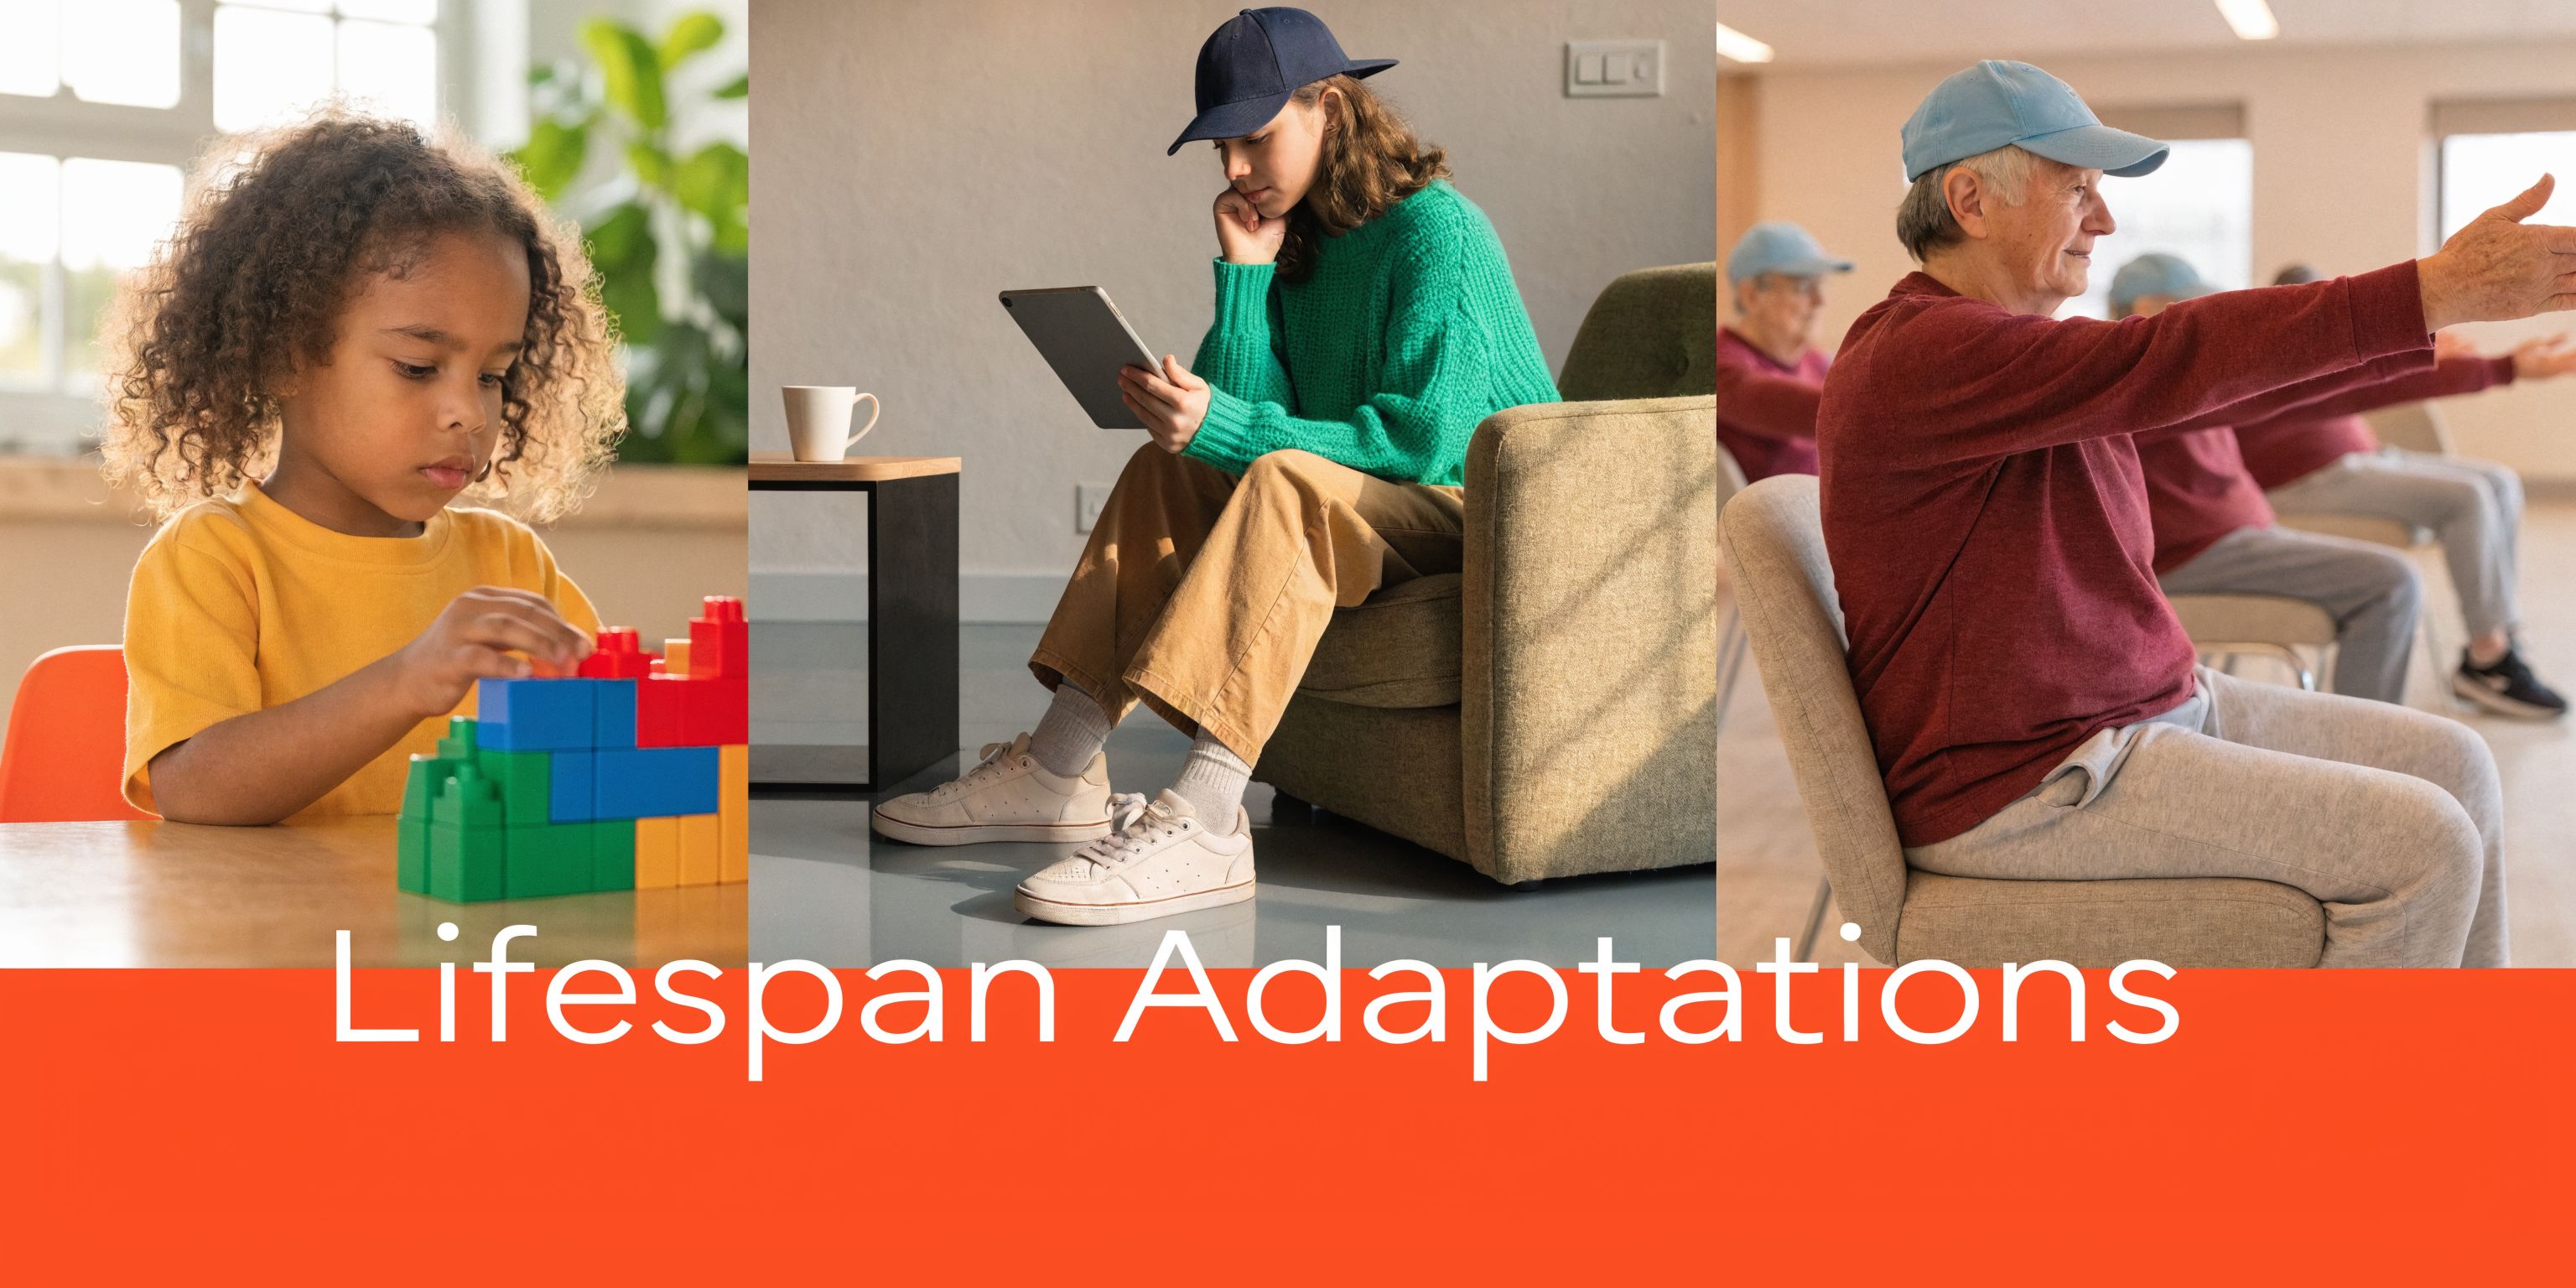
Dunn’s model stays useful because it isn’t tied to one age group or one diagnosis. The same logic applies in nursery classrooms, adolescent mental health clinics, concussion rehabilitation, adult neurodiversity services, and care settings for older adults.
Children in school and developmental care
In paediatric settings, the profile often helps teams separate sensory burden from “behaviour problems”. A child who resists assemblies, art, toileting routines, or lunch supervision may need environmental adaptation before they can show what they know.
The profile thus proves its worth. It gives schools a reasoned basis for supports like seating choices, auditory load reduction, movement breaks, tactile alternatives, and predictable transitions.
Adolescents and young adults
Teenagers often bring a different challenge. They may have insight, but they don’t always have language for what they’re experiencing.
An adolescent may say, “School drains me,” or “I can’t think in crowds,” without realising that sensory threshold is part of the picture. That can be especially relevant in counselling and school support work. For some families, additional reading on neurodiverse counselling support can help frame emotional support alongside sensory understanding.
Adults and older populations
In adult use, the profile often becomes powerful when executive demands are high. The verified AASP technical summary reports that sensation avoiding patterns correlate with 65% higher functional performance deficits in executive tasks, with processing speed reduced by 1.8 SD, and those quadrant scores clustering in the 45 to 60 out of 75 raw score range labelled “Much More Than Others” (AASP technical report summary).
That helps explain why some adults don’t merely dislike busy settings. They lose efficiency in them.
A practical vignette looks like this. An adult in vocational rehab performs well one-to-one but becomes overloaded in open-plan group tasks. The profile may reveal avoiding patterns that justify environmental changes, task segmentation, and self-regulation supports rather than assuming low effort.
For clinicians working across provincial systems, this overview of occupational therapy in Canada is a useful contextual resource when mapping sensory recommendations to broader service models.
Next Steps with Sensory Profile Dunn
A familiar clinic moment happens at the end of assessment. The caregiver questionnaire is scored, the quadrant pattern makes sense, and then the team still has to answer the harder question: what does this look like in daily performance over time?
That is where the next stage of practice is headed. Dunn’s Sensory Profile works best as one part of a living assessment process, not as a one-time snapshot filed away after interpretation. The profile shows the person’s sensory pattern. Digital cognitive tools can add what happens in real time, such as shifts in attention, processing speed, visual-motor control, and regulation during tasks.
For clinicians, the practical goal is simple. Put sensory findings beside performance data so patterns become easier to test, explain, and revisit.
Orange Neurosciences fits that model by pairing AI-supported cognitive assessment with ongoing performance tracking. Used well, this kind of workflow helps a team ask sharper questions. Does a child with high sensory avoiding also slow down when visual and auditory demands rise? Does an adult who reports overload show a drop in speed or accuracy only in busier task conditions? That comparison works like checking both the map and the traffic report before choosing a route. The Sensory Profile gives the map. Real-time data shows current conditions.
This approach also improves handoff across settings. An occupational therapist, psychologist, teacher, or rehab team member can look at the same profile pattern and compare it with objective task data rather than relying only on recall or isolated observations.
If you already use Sensory Profile Dunn, the next practical step is to build a workflow that includes:
quadrant findings from the profile
a small set of cognitive or motor performance measures
repeated check-ins to see whether supports change regulation and task efficiency
a shared way to communicate those changes to families and teams
Orange Neurosciences helps clinicians use that model in everyday practice. If you want a faster way to pair sensory insights with AI-powered cognitive assessment, real-time decision support, and progress tracking, visit Orange Neurosciences or contact the team by email to explore how OrangeCheck and ReadON can fit your workflow.

Orange Neurosciences' Cognitive Skills Assessments (CSA) are intended as an aid for assessing the cognitive well-being of an individual. In a clinical setting, the CSA results (when interpreted by a qualified healthcare provider) may be used as an aid in determining whether further cognitive evaluation is needed. Orange Neurosciences' brain training programs are designed to promote and encourage overall cognitive health. Orange Neurosciences does not offer any medical diagnosis or treatment of any medical disease or condition. Orange Neurosciences products may also be used for research purposes for any range of cognition-related assessments. If used for research purposes, all use of the product must comply with the appropriate human subjects' procedures as they exist within the researcher's institution and will be the researcher's responsibility. All such human subject protections shall be under the provisions of all applicable sections of the Code of Federal Regulations.


© 2026 by Orange Neurosciences Corporation