Mastering Test Retest Reliability Statistics
Nov 25, 2025

At their core, test-retest reliability statistics are a family of tools that help us answer a simple, crucial question: is our measurement consistent over time? These statistics—like Pearson's correlation, Intraclass Correlation Coefficients (ICC), and Cohen's Kappa—reveal if we can actually trust our data. They show us whether the same test, given to the same person under the same conditions, produces similar results on different days. This guide will provide practical examples and actionable insights so you can apply these concepts immediately in your work.
Why Consistent Measurement Is Your Research Superpower
Imagine you're trying a new diet and fitness plan. You step on your bathroom scale on Monday, and it says you weigh 150 pounds. You hop off, then step back on a minute later. This time, it flashes 165 pounds. Your first thought isn't about your progress; it's, "This scale is broken." You've completely lost faith in it because its readings are inconsistent.
That simple, practical example gets right to the heart of test-retest reliability. It’s the core principle that guarantees the tools we rely on—whether in a clinic, a classroom, or a research lab—give us stable, dependable results. Without that consistency, we’re left guessing. We can't be sure if a change in a score reflects a real change in the person, or if it's just random, meaningless noise from a shaky measurement.
The Bedrock of Trustworthy Data
In fields like healthcare and education, the stakes are incredibly high. A psychologist tracking a patient’s anxiety levels or a teacher measuring a student’s reading comprehension needs absolute confidence in their assessment tools. Strong test-retest reliability is what provides that confidence. It's the bedrock supporting every conclusion you draw.
Actionable Insight: Before implementing any new assessment in your practice or study, look for its published test-retest reliability statistics. If the reliability is low (e.g., below 0.70), you should be cautious about interpreting small changes in scores over time.
This is especially true in cognitive health. When evaluating something as complex as memory, consistency is everything. Dive deeper into this in our guide on what is cognitive assessment, which explains why precise, repeatable measurements are critical.
Think of a measurement tool like a skilled archer. A reliable archer can land their arrows in the exact same spot, shot after shot. Whether that spot is the bullseye (which is a question of validity) is another story, but their consistency (reliability) is the essential first step toward accuracy.
Separating Signal from Noise
Ultimately, we measure things repeatedly to detect meaningful change. Is a patient's cognitive function improving? Is a new teaching method boosting student performance? Reliable instruments give you the power to answer "yes" or "no" with confidence. They help you separate the "signal" (a true change) from the "noise" (random error).
Practical Example: A speech therapist measures a child's stuttering frequency. If the assessment tool is reliable, a decrease from 10 stutters per minute to 5 stutters per minute after therapy is likely a real improvement. If the tool is unreliable, that change could just be random fluctuation.
Mastering reliability ensures your findings aren't just interesting—they're credible. For researchers, exploring advanced methods like statistical shape modeling can offer powerful frameworks for quantifying changes. Understanding test-retest reliability statistics isn't just academic; it's a practical necessity for making important decisions based on data.
Choosing the Right Statistic for Your Data
Picking the correct test-retest reliability statistic is like choosing the right tool for a job. You wouldn't use a hammer on a screw. Applying the wrong statistic will give you misleading results. The type of data you've gathered is the single most important factor in this decision.
Data isn't all the same. It generally falls into one of three buckets: continuous, ordinal, or nominal. Each type needs its own specific approach. Getting this match right is the first step toward a solid analysis.
Making the right choice ensures your reliability coefficient truly reflects your tool's consistency, giving you a firm foundation for your conclusions.
Matching Statistics to Data Types
First, identify what kind of data your assessment produces. Think of it as sorting your laundry before you wash it—this simple step prevents headaches later.
Continuous Data: Measurements that can take any value within a range.
Practical Example: Reaction time in milliseconds, blood pressure readings, a score on a 100-point exam.
Ordinal Data: Data you can rank, but the gaps between ranks aren't equal.
Practical Example: A patient satisfaction survey with options like "Poor," "Fair," "Good," "Excellent." You know "Good" is better than "Fair," but not by how much.
Nominal Data: Purely categorical data with no order.
Practical Example: A diagnostic checklist where answers are "Yes/No" or "Present/Absent."
Actionable Insight: Before you collect any data, decide what type of data your instrument will produce. This will dictate your analysis plan from the start, saving you from having to backtrack later.
One of the most common pitfalls is using a simple correlation, like Pearson’s r, for every reliability test. It’s easy to calculate, sure, but it only shows the strength of a linear relationship, not true agreement. Two clinicians could be perfectly correlated if one consistently scores five points higher than the other, but they would have zero agreement—a huge flaw that Pearson’s r would completely miss.
This flowchart breaks down the decision-making process, guiding you from your initial measurement to figuring out if your data is genuinely trustworthy or just random noise.
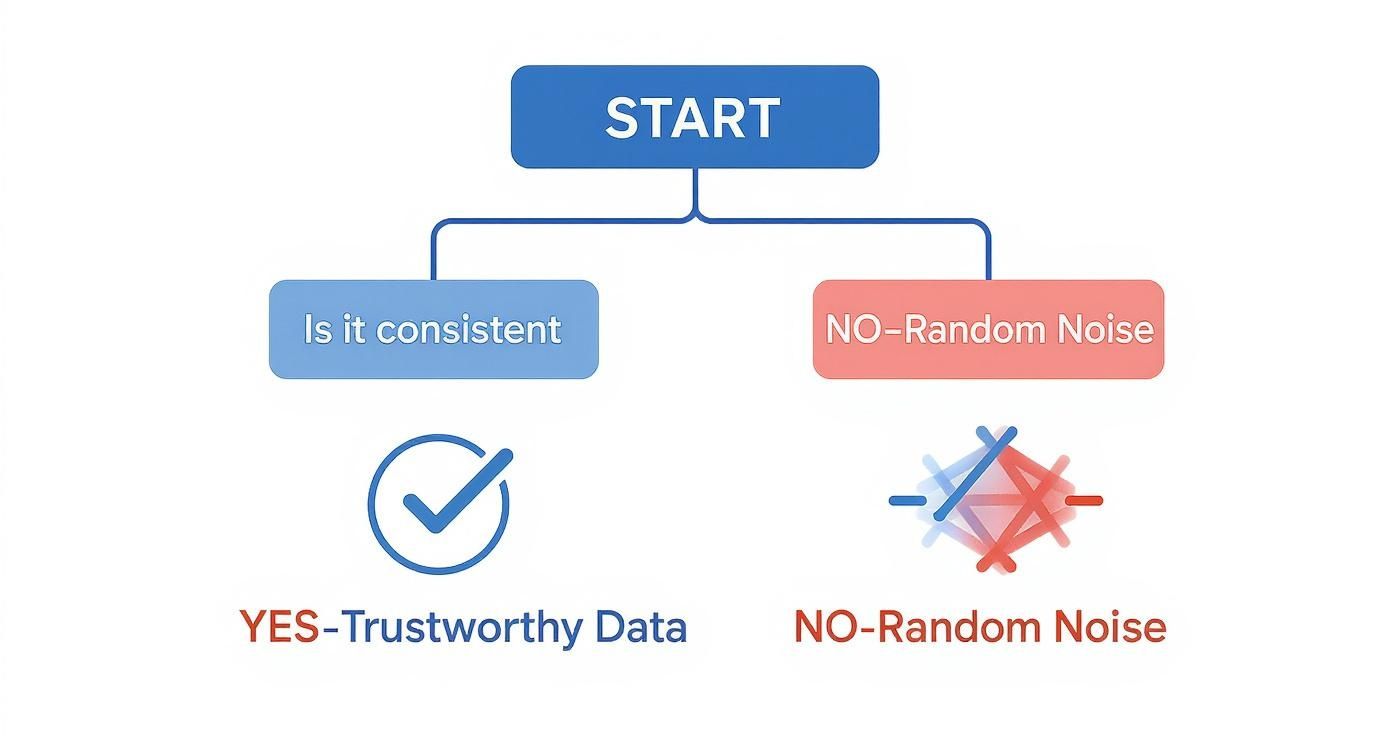
As the flowchart shows, consistency is the gatekeeper of quality data. Without it, your measurements are little more than random fluctuations.
Your Guide to Reliability Statistics
Here’s a quick-reference table to help you pick the right statistic based on your data and what you want to find out.
Statistic | Best Use Case | Data Type | What It Measures |
|---|---|---|---|
Intraclass Correlation (ICC) | Assessing consistency of ratings for continuous measurements | Continuous | The level of absolute agreement between two or more measurements |
Spearman's Correlation | Checking the consistency of ranked data over time | Ordinal | The strength and direction of the relationship between two sets of ranks |
Cohen's Kappa (κ) | Determining agreement between two raters on categorical judgments | Nominal | Inter-rater agreement for categorical items, corrected for chance |
Bland–Altman Plot | Visualizing agreement and identifying systematic bias | Continuous | The difference between two measurements against their average |
Standard Error of Measurement | Quantifying the amount of error in individual scores | Continuous | The precision of individual scores in the units of the original test |
Minimal Detectable Change | Finding the smallest change that isn't just measurement error | Continuous | The threshold for determining if a change in scores is statistically real |
This table should give you a solid starting point. Now, let’s dig into the most common tools you'll be using.
A Closer Look at Key Statistics
Once you know your data type, you can confidently select the right statistic. Here are the heavy hitters in the test-retest reliability world and when to use them.
1. Intraclass Correlation Coefficient (ICC) For continuous data, the ICC is your go-to. It's robust because it measures both correlation and absolute agreement. This makes it superior when you need to know if different measurements are the exact same, like multiple clinicians taking a patient's blood pressure.
2. Spearman’s Rank Correlation Coefficient When working with ordinal data (rankings or scales), Spearman’s correlation is a great choice. It looks at the relationship between the ranks of the data, not the raw values. It's perfect for seeing if survey responses are consistent.
3. Cohen’s Kappa (κ) For nominal data, Cohen’s Kappa is the gold standard. It measures how much two tests agree, but it cleverly accounts for agreement by pure chance. This is what you need when checking the reliability of a diagnostic checklist where a clinician makes a "yes" or "no" call.
This is especially relevant for the many cognitive tests online, which often produce a mix of continuous data (reaction time) and categorical data (correct vs. incorrect). Knowing which statistic to apply is crucial for correct interpretation.
By carefully choosing your statistical approach, you protect the integrity of your findings and build real confidence in your assessment tools.
Unpacking the Intraclass Correlation Coefficient (ICC)
When you need a precise and versatile tool for measuring reliability, the Intraclass Correlation Coefficient (ICC) is often the gold standard. While other test-retest reliability statistics have their place, the ICC digs deeper. It assesses not just how consistently scores move together, but how closely they agree in absolute terms.
Practical Example: Think of two judges at a diving competition. A simple correlation might show that both judges consistently rank the divers in the same order. But what if one judge is a tougher marker, always giving scores a full point lower than the other? The ICC is smart enough to catch this systematic difference. It would reveal that while the judges are consistent in their rankings, their absolute agreement is poor.

This unique ability to spot systematic error is exactly why the ICC is so essential in clinical and research settings where precise measurements are non-negotiable.
Choosing the Right ICC Model
The ICC isn't just one statistic. It's a family of them, with different versions for specific study setups. Picking the right one is critical—the wrong choice can lead to misleading conclusions.
The choice boils down to what you're trying to prove.
Consistency: Do you only care if scores move up and down together, even if there's a consistent offset? Useful when raters use slightly different internal scales but rank individuals similarly.
Absolute Agreement: Do you need the scores to be almost identical? This is what you need for calibrating medical devices or ensuring two clinicians get the same reading for a patient's range of motion.
Actionable Insight: For most test-retest reliability studies, absolute agreement is the goal. You need to know that a score of 85 on Monday means the same thing as a score of 85 on Friday. When you run your analysis in a program like SPSS, be sure to select the "Absolute Agreement" type.
A Practical Example in Physical Therapy
Let’s make this real. Imagine a study where two physical therapists measure a patient's shoulder flexion (how high they can raise their arm) on two different days to check their protocol's reliability.
The scenario:
Day 1: Therapist A measures 150 degrees; Therapist B measures 155 degrees.
Day 2: The patient's mobility hasn't changed. Therapist A again measures 150 degrees, and Therapist B again measures 155 degrees.
A simple correlation might show a perfect relationship because both therapists' scores were stable. But an ICC focused on absolute agreement would produce a lower value because Therapist B consistently records scores 5 degrees higher. This instantly flags a potential systematic bias that you need to investigate.
The real power of the ICC is its ability to tell you what proportion of the score differences comes from true variation between subjects, versus what’s just noise from measurement error or rater bias. It gives you a single, clear number that sums up how dependable your data really is.
Interpreting ICC Values
So, you've calculated your ICC. What does the number actually mean? The value will always be between 0 and 1, where 1 represents flawless reliability. While every study is different, these general guidelines are a great starting point for interpretation:
Below 0.50: Poor reliability
0.50 – 0.75: Moderate reliability
0.75 – 0.90: Good reliability
Above 0.90: Excellent reliability
For high-stakes clinical decisions, researchers almost always aim for an ICC of 0.90 or higher. This gives them confidence that any changes they see are genuine.
This level of precision is also crucial when you're developing tools like a Perceived Stress Questionnaire, where consistent scoring is the only way to reliably track shifts in an individual’s mental state over time.
By understanding and correctly applying the ICC, you move past simple correlations and gain a true picture of your measurement's stability.
Gauging Real Change with SEM and MDC
You’ve established that your measurement tool is reliable with a strong ICC score. Great. But what happens next? When a patient's score on a cognitive assessment goes up by three points, what does that actually mean? Is it genuine improvement, or just statistical noise?
This is where two critical test retest reliability statistics come into play: the Standard Error of Measurement (SEM) and the Minimal Detectable Change (MDC). These tools give you the power to separate real, meaningful progress from the inherent fuzziness of measurement error.

Think of SEM and MDC as the magnifying glass for interpreting score changes. They allow you to move beyond guesses and make confident, evidence-based decisions.
Understanding the Standard Error of Measurement (SEM)
The Standard Error of Measurement (SEM) represents the built-in "margin of error" for any test score. No assessment is perfectly precise. There's always a bit of wobble, and the SEM quantifies that wobble, using the same units as the test itself.
Practical Example: Imagine taking your temperature with a highly accurate digital thermometer. Three times in a row, you might see slight variations: 36.6°C, 36.7°C, and 36.5°C. That small, expected variation is what the SEM captures.
The key takeaway here is that a person doesn't have one single, absolute "true score." They have a range where their true score most likely falls. The SEM helps you define the boundaries of that range, giving you a confidence interval around any score you measure.
A smaller SEM indicates a more precise test. This statistic trains us to see a score not as a single point, but as a reliable estimate within a predictable range.
From SEM to Minimal Detectable Change (MDC)
The Minimal Detectable Change (MDC) is calculated from the SEM, and it answers a hugely important question: what's the smallest change in a score that we can be confident is real and not just random error?
For clinicians, this is a game-changer. The MDC provides a clear, defensible threshold for what constitutes meaningful progress.
If a cognitive test has an MDC of 4 points, any change smaller than that—say, a 2-point improvement—could very well be due to chance. But if a patient's score increases by 5 points, you've crossed that threshold. You now have statistical confidence that the individual has genuinely improved.
A Practical Example in Cognitive Training
Let's see this in a clinical setting. A therapist tracks a patient's recovery after a concussion using a cognitive assessment with a maximum score of 100.
Baseline Score: The patient scores 65 on their first assessment.
Established MDC: Previous reliability studies for this test have calculated an MDC of 6 points.
Follow-Up Score: After four weeks of therapy, the patient is retested and scores 72.
Actionable Insight: Is this a real improvement? The change is 7 points (72 - 65). Because 7 is greater than the MDC of 6, the therapist can confidently conclude that the patient's cognitive function has shown a statistically significant improvement. This validates the treatment plan and allows the therapist to provide concrete feedback. This logic is applied in well-known tools like the Montreal Cognitive Assessment instructions.
Without knowing the MDC, that 7-point change would be ambiguous. By using these advanced statistics, they can shift from guesswork to evidence-based practice and make better decisions.
Putting Reliability Statistics into Practice
Theory is one thing, but seeing how test-retest reliability statistics work in the real world is where the understanding clicks. These numbers aren't just for academic papers; they're vital tools professionals use every day to make critical decisions.
Let's walk through a few practical scenarios to see how these concepts translate into tangible actions.
Case Study 1: The School District Standard
A large school district needs to track students' academic growth using a standardized reading comprehension test. For the results to mean anything, they must be sure the test is consistent.
The Challenge: If a student's score goes up, is it because they've become a better reader, or is it a random blip?
The Method: The district runs a pilot study, giving the test to 200 students twice, with a two-week gap.
The Statistic: They calculate an Intraclass Correlation Coefficient (ICC) for absolute agreement.
Actionable Insight: An ICC value of 0.92 is fantastic. It gives the district huge confidence that the test is highly reliable. This means that when they see a student's score jump from 75% to 85%, it’s a sign of genuine learning, not measurement error. This empowers them to accurately assess teacher effectiveness and allocate resources effectively.
Case Study 2: Tracking Cognitive Health in Older Adults
A neuropsychologist needs to monitor a patient for early signs of cognitive decline using the California Verbal Learning Test (CVLT-2). Consistency is everything—a misinterpretation could cause unnecessary anxiety or a missed diagnosis.
To ensure the CVLT-2 is a stable measure, researchers conduct long-term studies. One such study provides crucial test-retest reliability statistics for older adults. Researchers found that over an average interval of 1.3 years, the test-retest correlations for the CVLT-2 fell between 0.57 and 0.69. While modest, this indicates meaningful stability for long-term tracking.
The analysis also showed that between 88% and 97% of participants demonstrated stable memory performance.
Actionable Insight: This data gives the neuropsychologist a benchmark. If a patient’s score drops far more than what these reliability stats suggest is normal, it raises a red flag that requires a closer look. Suddenly, a simple test score becomes a vital clinical indicator, prompting further investigation.
This is where reliability transforms from a statistical concept into a cornerstone of patient care. When a clinician can trust their assessment tool is stable, they can more confidently distinguish between normal aging and the onset of a neurodegenerative condition.
How Orange Neurosciences Applies These Principles
At Orange Neurosciences, these principles are at the heart of everything we do. Our cognitive assessment tools are designed to provide precise, repeatable data that helps clinicians, educators, and families track cognitive function. We know that for progress to be meaningful, the measurement must be rock-solid.
During development, we use rigorous test-retest reliability statistics to validate our platforms' consistency. This is how we ensure that when a user sees their attention scores improve, they can trust it reflects real cognitive enhancement. By building our tools on a foundation of proven reliability, we empower people to make informed decisions about their cognitive health.
This commitment to evidence-based measurement is a core part of our solution, ensuring every data point is dependable. To see how our validated tools can bring this level of precision to your practice, visit our website or contact us for a demonstration.
Your Blueprint for a Rock-Solid Reliability Study
Running a good test-retest reliability study is about more than just giving a test twice. It’s about careful planning to make sure your results mean something. This guide will walk you through the essentials.
Think of it like building a house. You wouldn't start laying bricks without a solid foundation. A well-designed reliability study is the foundation for any claim you make about your assessment tool.
Designing Your Study for Success
The design phase is where the most important decisions happen. Getting this part right helps you dodge common mistakes. The two biggest factors to nail down are your sample size and the time between tests.
1. Determining the Right Sample Size You need enough people to get stable and precise test-retest reliability statistics. There isn't a single magic number, but a sample that’s too small can give you estimates that are all over the place. Your goal should be a sample that truly represents the population you plan to use the assessment with.
2. Selecting the Perfect Time Interval Picking the right amount of time between tests is a balancing act.
Too short: Participants might just remember their answers, faking high reliability. We call this a practice effect.
Too long: The actual trait you're measuring could genuinely change, making the test look less reliable than it really is.
Actionable Insight: The sweet spot depends entirely on what you're measuring. For a stable trait like personality, several weeks or months might be fine. For something that changes quickly, like anxiety, a few days to a week is usually a much better bet.
Avoiding Common Pitfalls
Even with the best plan, a few classic issues can trip you up.
Participant Fatigue: Don't schedule tests too close together or make sessions drag on. Tired people make careless mistakes.
Environmental Changes: Do everything you can to keep testing conditions identical. Little things like different lighting, noise levels, or instructions can throw off results.
Motivation Drift: Frame the retest as being just as important as the first to keep participants' effort consistent.
A study in a California school district administered assessments twice within one week and found good reliability (0.77 to 0.87). They credited this to being obsessive about minimizing external differences between sessions. You can learn more from the research on test-retest reliability statistics.
A Checklist for Reporting Your Results
Once your data is analyzed, how you report it is critical for credibility. Your report needs to give others a clear window into your methods.
A study's value isn't just in its findings, but in its transparency. Clear reporting allows the scientific community to build upon your work with confidence, knowing exactly how you arrived at your conclusions.
Actionable Insight: Use this checklist to make sure your report tells the whole story:
Participant Details: Clearly describe your sample (how many people, their demographics).
Testing Procedures: Explain exactly what you did, including the time interval between tests.
Statistical Choices: Justify why you chose a specific reliability statistic (e.g., ICC, Kappa).
Results: Report the reliability coefficient, its confidence interval, and the SEM or MDC.
Interpretation: Explain what your findings mean in a practical, real-world context. What does this number tell us?
By following this blueprint, you can produce trustworthy data. To see these principles expertly applied, explore the validated solutions on the Orange Neurosciences website and reach out to our team to learn more.
Your Questions, Answered
When digging into test-retest reliability, a few questions always pop up. Let's tackle some of the most common ones.
What’s a Good Test-Retest Reliability Score?
It depends, but there are solid benchmarks.
For most research, a score of 0.70 is often seen as the minimum for "acceptable" reliability. Above 0.80 is "good," and anything over 0.90 is generally considered "excellent."
Actionable Insight: For high-stakes decisions, like a clinical diagnosis, the bar is set much higher. In those cases, you really want to see reliability at 0.90 or greater to be confident that you're making choices based on truly dependable data.
How Is This Different From Inter-Rater Reliability?
This gets to the heart of what you're trying to measure.
Test-retest reliability is about stability over time. It answers, "If I give the same person the same test on Monday and again on Friday, will I get roughly the same score?" It's a measure of the test's own consistency.
Inter-rater reliability is about consistency between different people. It asks, "If two different clinicians score the same patient's performance, will they agree?" This is about removing the subjectivity of the observer.
What Is the Ideal Time Between Tests?
Finding the perfect time gap is a balancing act.
You need the interval to be long enough that the person doesn't just remember their answers—what we call practice effects. But it needs to be short enough that the trait you're measuring hasn't genuinely changed.
Practical Example: For something that changes quickly, like mood, a few days might be right. For stable personality traits, you might wait several months. While we can offer general guidance, every study is unique. If you're wrestling with a tricky design, we always suggest you consult experts for specific questions who can dig into the details of your work.
At Orange Neurosciences, our AI-powered tools are built on a foundation of strong reliability, giving you the confidence to make better-informed decisions. Explore our evidence-based platform for precise cognitive assessment and targeted therapy at https://orangeneurosciences.ca. Ready to bring this level of precision to your work? Contact our team for a personalized consultation.

Orange Neurosciences' Cognitive Skills Assessments (CSA) are intended as an aid for assessing the cognitive well-being of an individual. In a clinical setting, the CSA results (when interpreted by a qualified healthcare provider) may be used as an aid in determining whether further cognitive evaluation is needed. Orange Neurosciences' brain training programs are designed to promote and encourage overall cognitive health. Orange Neurosciences does not offer any medical diagnosis or treatment of any medical disease or condition. Orange Neurosciences products may also be used for research purposes for any range of cognition-related assessments. If used for research purposes, all use of the product must comply with the appropriate human subjects' procedures as they exist within the researcher's institution and will be the researcher's responsibility. All such human subject protections shall be under the provisions of all applicable sections of the Code of Federal Regulations.


© 2026 by Orange Neurosciences Corporation