Test and retest reliability: A practical guide to measuring consistency
Dec 6, 2025

Imagine you step on a bathroom scale one morning and it reads 150 pounds. You step on it again a minute later, and it still shows 150 pounds. That simple consistency is the core idea behind test–retest reliability.
It’s all about stability. It answers a straightforward, practical question: if we measure something twice under the same conditions, do we get the same result?
What Test–Retest Reliability Really Means
At its heart, test–retest reliability is how we measure the consistency of a tool. Whether it’s a clinical diagnostic test, a cognitive assessment, or an employee aptitude survey, we need to trust that the results aren’t just random noise.
High reliability means you can feel confident that a change in scores reflects a genuine change in the person being measured—not just a wobble in the test itself.
Think of it like a dependable GPS. If you ask for directions to the same coffee shop on Monday and again on Tuesday, you expect it to show you the same route. If it sent you on a wild goose chase one day and a straight shot the next, you’d quickly lose faith. A reliable cognitive test is no different; it must give stable results when the same person takes it under similar conditions at different times.
Why This Consistency Is Crucial
This isn’t just some dry academic detail. It has serious, real-world consequences in many fields. For anyone involved in a systematic approach to objective data gathering, from physical performance testing to clinical trials, understanding reliability is non-negotiable.
Here’s where it really hits home with practical examples:
Clinical Diagnostics: A psychologist uses a cognitive screening tool to track a patient's memory over six months. If the tool has high test–retest reliability, a drop in the score strongly suggests a real change in cognitive function. This actionable insight helps them make an informed decision about adjusting treatment.
Educational Assessment: A school district uses a standardized test to see how students are progressing year over year. If the test is reliable, teachers and administrators can trust that score improvements mean students are actually learning. This helps them make smart, data-driven decisions about curriculum changes.
Hiring and Development: A company uses a personality assessment to build stronger teams. A reliable tool ensures an employee’s profile is stable, giving managers a solid foundation for coaching and long-term development plans instead of acting on random fluctuations.
The promise of a reliable test is simple: It separates the signal from the noise. It helps you distinguish between a meaningful change and random measurement error. That's the bedrock of any valid assessment.
When reliability is low, the consequences can be severe—misdiagnoses, ineffective educational programs, and poor talent management. The stakes are incredibly high, especially in complex fields like cognitive science where our tools must be both sensitive enough to detect change and stable enough to be trusted.
To see these principles in action, it's helpful to understand what goes into a full neuropsychological assessment and why consistency is a non-negotiable part of the process.
This guide will walk you through everything you need to know about measuring, interpreting, and improving the consistency of your assessments. For a deeper look at our reliable assessment tools, contact us for a demo.
Key Aspects of Test and Retest Reliability at a Glance
This table summarizes the core concepts we'll be exploring. Think of it as a quick reference guide to keep the main ideas straight as we dive deeper.
Component | What It Measures | Why It's Important |
|---|---|---|
Consistency Over Time | The stability of results from the same test, on the same person, at different times. | Ensures that changes in scores reflect actual changes in the trait, not test flaws. |
Measurement Error | The "noise" or random variability that can affect a test score. | High reliability means low measurement error, leading to more trustworthy results. |
Confidence in Results | The degree of trust you can place in the test's ability to produce stable scores. | Crucial for making informed decisions in clinical, educational, and research settings. |
Each of these elements plays a vital role in ensuring that a test is not just accurate at a single point in time, but dependable over the long haul.
How to Measure and Analyze Your Data
So, you understand that test-retest reliability is all about consistency. That's the first step. The next question is, how do you actually measure it? Just eyeballing two sets of scores won't cut it. You need the right statistical tools to turn that raw data into a clear, defensible verdict on your test's stability.
Let's walk through the most common methods people use. Each one gives you a slightly different lens to view your data, and knowing which one to use—and when—is the key to a solid analysis.
This simple flowchart helps visualize the core question that reliability aims to answer.
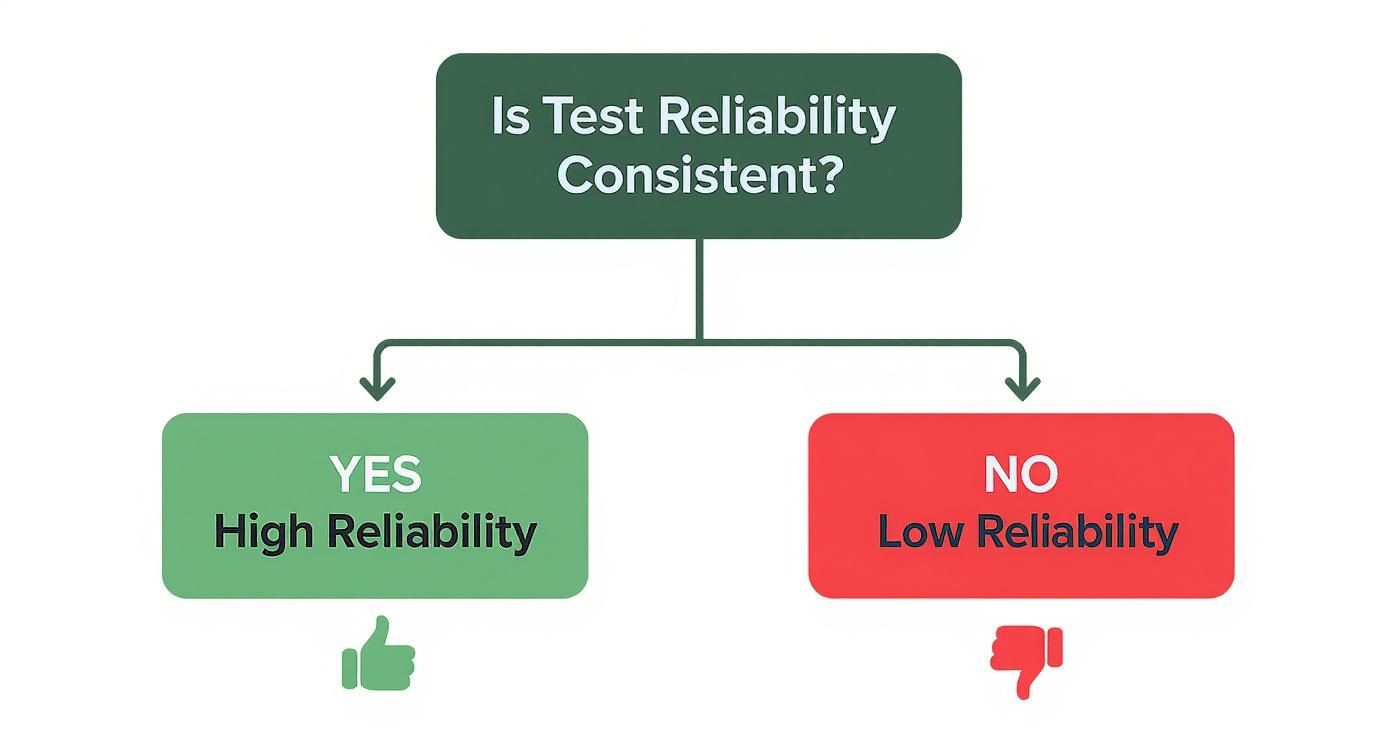
As you can see, if the results stay consistent over time, you've got high reliability. If they're all over the map, reliability is low. Simple as that.
The Pearson Correlation Coefficient (r)
Often, the first tool people grab is the Pearson correlation coefficient (r). It’s a familiar statistic that measures the strength and direction of a linear relationship between two sets of scores, spitting out a value between -1 and +1. A score near +1 means that people who scored high the first time also tended to score high the second time.
Practical Example: 20 students take a reading test. Two weeks later, they take it again. If the top performers are still at the top and the bottom performers are still near the bottom, you’ll get a strong positive correlation, maybe something like r = 0.85.
But here's the catch—and it's a big one. The Pearson r has a massive blind spot: it completely misses systematic errors. Imagine if every single student scored exactly 10 points higher on the retest because they got better with practice. The correlation would still be a perfect +1.0 because everyone’s rank order stayed the same. This flaw makes it a poor choice when you need to know if the scores are truly in agreement.
The Intraclass Correlation Coefficient (ICC)
This brings us to a much better, more robust tool for the job: the Intraclass Correlation Coefficient (ICC). Unlike Pearson's r, the ICC is specifically designed to measure both the consistency of the rank order and the actual agreement between the scores. It’s smart enough to detect those systematic biases that the Pearson correlation ignores.
The ICC has become the gold standard for measuring test-retest reliability because it compares the real differences between your subjects to the total variation in the scores. Put simply, it tells you how much of the score variation is due to genuine differences between people versus just random noise or other errors.
There are several types of ICC, and choosing the right one hinges on your specific study design. For a deeper dive into the nuances, check out our guide on the statistics behind test-retest reliability. Generally, a "two-way" model that accounts for both the subjects and the different testing times is the way to go for most test-retest studies.
The ICC doesn't just ask, "Do the scores move up and down together?" It asks, "Are the scores actually the same?" This focus on absolute agreement is precisely why it's the superior choice for clinical and educational assessments.
Visualizing Agreement with Bland-Altman Plots
While coefficients like the ICC boil reliability down to a single number, a Bland-Altman plot offers a fantastic visual deep dive. This graph doesn't show correlation at all. Instead, it plots the difference between the two measurements against their average.
This visual approach lets you spot things a single number could never reveal:
Is there a systematic bias? If the retest scores are always a bit higher, you’ll see the points cluster above the zero line.
Does the error depend on the score? Sometimes a test is less reliable for very high or very low scorers. A Bland-Altman plot shows you if the gap between test and retest scores widens as the average score gets bigger.
Are there any major outliers? The plot makes it incredibly easy to see individuals whose scores changed dramatically from one test to the next.
By using these methods together—Pearson for a quick first look, ICC for a robust score of agreement, and a Bland-Altman plot to see the full picture—you can build a truly comprehensive and convincing analysis of your assessment's test-retest reliability.
Key Factors That Influence Your Reliability Results
Achieving high test and retest reliability isn't about luck; it's about thoughtful design. While the statistical methods are essential for the final analysis, the real work happens long before you collect a single piece of data. Several key factors can dramatically influence your results, easily turning a potentially solid assessment into an unreliable one if you're not careful.
Getting a handle on these variables is the first step toward building a measurement tool you can genuinely trust. It’s all about controlling what you can to minimize the noise and let your signal shine through.
The Time Interval Between Tests
One of the most critical decisions you'll make is how long to wait between the first test and the retest. This isn't just a random choice—it's a delicate balancing act.
Get the timing wrong, and you could introduce a serious bias into your findings.
Too short: If the retest is too soon (say, a day or two later), people might just remember their previous answers. This "memory effect" can falsely inflate your reliability scores, making your assessment appear more consistent than it really is.
Too long: Wait too long (maybe several months), and the person may have genuinely changed. They could have learned a new skill, gone through a life event that shifted their mood, or simply matured. In this scenario, a low reliability score doesn't mean your test is bad; it reflects real, meaningful change.
Actionable Insight: The perfect interval really depends on what you're measuring. For a stable personality trait, a few weeks is ideal. For something that fluctuates, like mood or stress, a few days is much more suitable. Always document your reasoning for the chosen interval.
The Stability of the Construct
This brings us to our next point: the very nature of what you’re trying to measure, known as the construct. Some traits are naturally stable, while others are expected to change. You absolutely have to consider this before you even start your study.
For example, measuring someone's general intelligence (IQ) is a different ball game than measuring their current anxiety level. IQ is considered a relatively stable trait throughout adulthood. Anxiety, on the other hand, is a state that can swing wildly from one day to the next.
You’d expect a test measuring a stable construct like cognitive processing speed to show high test-retest reliability over several weeks. But you'd expect a test measuring a fleeting state like alertness to have lower reliability over that same period, simply because alertness naturally varies.
If you don't account for construct stability, you're bound to misinterpret your results. A low reliability score for an anxiety questionnaire isn't necessarily a failure; it might be accurately capturing the natural ebb and flow of human emotion. A solid grasp of the language of assessment is crucial for making these kinds of distinctions.
Sample Characteristics
Who you test is just as important as how you test them. The characteristics of your participant group—your sample—can have a huge impact on your reliability coefficient. A sample that is too uniform can artificially lower reliability, while a more diverse group often gives you a more accurate picture.
Practical Example: Imagine you’re testing a new math assessment. If you only test it on a group of advanced calculus students, their scores will likely be bunched up at the top. With so little variation, it becomes statistically challenging to see consistency, which could lead to a lower reliability score than the test actually deserves. Now, test that same assessment on a wide range of students from different grades and ability levels. You'll get a wider spread of scores, making it easier to see if people hold their rank from the first test to the second, usually resulting in a stronger and more realistic reliability estimate.
Standardization of Testing Conditions
Finally, the testing environment has to be consistent. Every little detail, from the instructions you give to the temperature in the room, should be kept as similar as possible for both the test and the retest.
This consistency extends beyond simple instructions to the tools themselves. In clinical research, the reliable performance of specific laboratory equipment is absolutely essential for getting dependable data. Even tiny variations can introduce error.
Actionable Insight: For any assessment, create a strict administration protocol.
Use a script: Read the exact same instructions to every person, every single time.
Control the environment: Use the same room, lighting, and noise levels if you can.
Standardize timing: Be precise with any time limits the test requires.
By carefully managing these four factors—the time gap, construct stability, your sample, and the testing conditions—you can design a study that gives you a true and meaningful measure of your assessment's test and retest reliability.
How to Interpret Reliability Coefficients
So, you've crunched the numbers and now you're staring at a single coefficient, maybe a 0.85. What does that actually tell you about your assessment? Making sense of a reliability coefficient isn't just a simple case of "good" or "bad"—it’s about understanding what that number means in the real world.
Think of it like a weather forecast. A 70% chance of rain feels very different if you’re planning a backyard wedding versus just driving to the office. The number itself is static, but the stakes change everything. The same is true for test-retest reliability.
From Abstract Numbers to Actionable Insight
To get our bearings, we can start with some generally accepted benchmarks. These categories are a helpful first step for framing your results.
Excellent Reliability: Coefficients above 0.90
Good Reliability: Coefficients between 0.80 and 0.90
Acceptable Reliability: Coefficients between 0.70 and 0.80
Poor Reliability: Coefficients below 0.70
But remember, these are just guidelines. The golden rule is that context is king. A coefficient that's perfectly fine in one scenario could be dangerously unreliable in another.
Practical Example: A real-world study of educational assessments in a California school district found reliability coefficients from 0.77 to 0.87. For making decisions about student placement, these "acceptable" to "good" values give educators the confidence they need to act on the test results.
Why Context Determines the Stakes
Let’s dig into two very different scenarios to see why this matters so much.
Scenario 1: The Low-Stakes Research Survey Imagine you’re piloting a new questionnaire to gauge general workplace satisfaction for an internal study. A reliability score of 0.70 is probably acceptable here. If the tool is a bit inconsistent, the consequences are minor—maybe some slightly noisy data in an exploratory project. No one's career is on the line.
Scenario 2: The High-Stakes Clinical Diagnosis Now, picture a cognitive test designed to screen for early signs of dementia. A reliability score of 0.70 would be completely unacceptable. An unreliable score could lead to a devastating misdiagnosis, causing a family immense distress, or worse, delaying critical treatment. In this high-stakes world, you’d demand a reliability coefficient well above 0.90 before you could trust the results.
The table below offers a guide for matching reliability values to the specific demands of your project, whether you're in the early stages of research or making critical clinical judgments.
Interpreting Test-Retest Reliability Coefficients
Coefficient Value (e.g., ICC) | General Interpretation | Example Application |
|---|---|---|
> 0.90 | Excellent | Clinical diagnostic tools, high-stakes assessments (e.g., dementia screening, professional certifications). |
0.80 – 0.90 | Good | Individual-level assessments for progress monitoring, core research outcome measures. |
0.70 – 0.80 | Acceptable | Group-level research, exploratory studies, low-stakes surveys where some noise is tolerable. |
< 0.70 | Poor / Unacceptable | Not recommended for most applications, especially where individual scores are used for decision-making. |
Ultimately, a "good" number depends entirely on the question, "What decision will be made based on this score?"
Introducing the Standard Error of Measurement
To make this even more practical, we can turn to a statistic called the Standard Error of Measurement (SEM). The SEM is brilliant because it translates the abstract reliability coefficient into a concrete margin of error for any individual's score. It answers the question: "If this person took the test again, how much would their score naturally bounce around?"
Actionable Insight: If a student scores 110 on a cognitive test with an SEM of 5 points, you can be reasonably confident their "true" score is somewhere between 105 and 115. A smaller SEM means a more precise and dependable test.
The SEM moves you from a group-level statistic (the reliability coefficient) to an individual-level understanding. It makes the abstract concept of reliability concrete by showing you the real-world wiggle room around every single score.
This is especially critical when you're tracking changes over time. If a patient’s score on a memory test improves by 3 points, but the test’s SEM is 5, that "improvement" is likely just random noise. But if their score jumps by 12 points, you can be much more confident a genuine change has happened. Understanding the SEM is also vital when interpreting results from tools like a Perceived Stress Questionnaire, where you need to distinguish real shifts in well-being from simple measurement error.
Common Mistakes That Undermine Reliability
Even with the best of intentions, a few common mistakes can quietly sink your test and retest reliability study, leaving you with results that are misleading or just plain wrong. Think of this as your field guide to what can go wrong—and more importantly, how to sidestep these traps to ensure your findings are solid.
These errors aren't just minor statistical hiccups. They can fundamentally flaw your conclusions about whether an assessment is stable over time. Getting to know them is the first step toward designing a study that actually holds water.
The Problem of Practice Effects
One of the most frequent culprits is the practice effect. This is what happens when someone scores higher the second time around simply because they've seen the test before. It's not a true improvement in their ability; it's just familiarity with the format or questions.
Practical Example: Imagine giving someone a complex puzzle. The first time, they're figuring out the rules and finding a strategy. The second time, they already know the drill and can jump right in. Of course, they'll finish faster. It’s not because they got smarter overnight—it’s because they learned the test.
Practice effects can artificially inflate reliability scores, making a test look more consistent than it really is. The change isn't due to the stability of the trait you're measuring, but to memory and familiarity.
Actionable Insight:
Use Alternate Forms: The gold standard is to use a parallel version of the test for the retest. These forms have different questions but are carefully designed to be equal in difficulty and content.
Increase the Time Interval: Putting more time between the test and retest also helps. A person is far less likely to remember specific questions after several weeks have passed.
Overlooking Regression to the Mean
Another subtle but powerful force is regression to the mean. This is the natural tendency for anyone who scores at the extremes—either way up high or way down low—on the first test to score closer to the average on the second.
This isn’t a flaw in the test itself but a statistical reality. An unusually high score was likely a mix of true skill and a bit of good luck. On the retest, that luck probably won't strike twice, and their score "regresses" back toward their actual average ability. It works the other way, too, with unusually low scores often improving toward the mean.
The Pitfall of Sampling Bias
Finally, sampling bias can completely torpedo your study's credibility. This happens when the group of people you test isn't a good representation of the larger population you want to talk about.
Practical Example: If you're developing a new cognitive test and you only test it on university students, you can't assume the reliability results will be the same for older adults or people from different educational backgrounds. Your sample has to match your target audience.
A key study on the California Verbal Learning Test (CVLT) really drives this point home. Researchers tested 157 healthy older adults with a 1.3-year interval between tests. They found reliability coefficients from 0.50 to 0.72—showing moderate to good long-term stability for that specific age group. This highlights just how critical population-specific data is.
Actionable Steps for Improving Reliability
Turning theory into practice is what separates a good assessment from a great one. You can actively boost the test and retest reliability of your tools by focusing on clear, intentional design right from the start. This isn't about hoping for consistency; it's about building it into the DNA of your assessment.

Think of it as setting the stage for success. Each step you take to reduce ambiguity and standardize the experience helps minimize measurement error and lets the true score shine through.
Standardize Your Administration Procedures
The single most effective way to improve reliability is to ensure every participant has the exact same experience. Consistency is non-negotiable.
You need a detailed protocol that covers every single aspect of the assessment, leaving nothing to chance. Your goal is to eliminate any variations that could add noise to the data.
Scripted Instructions: Write out exactly what you will say to participants. Read it verbatim every single time, whether you're testing one person or one hundred.
Controlled Environment: If possible, administer the test in the same setting. Control for things like lighting, temperature, and background noise to keep conditions uniform.
Consistent Timing: Use a stopwatch or digital timer to enforce time limits precisely. Even small differences in timing can lead to big differences in scores.
Write Crystal-Clear Instructions and Items
Ambiguity is the enemy of reliability. If participants don't understand what you're asking, their responses will be all over the place. Every instruction and test item must be direct, simple, and unambiguous.
Vague questions produce vague answers. Your instructions should be so clear that there’s only one possible way to interpret them. This simple step can dramatically reduce measurement error.
Before finalizing your assessment, have a few people from your target audience read through everything. Ask them to explain what they think they’re being asked to do. If there's any confusion at all, rewrite it until it's gone.
The Power of Pilot Testing
Never, ever skip the pilot phase. Pilot testing is your dress rehearsal—it's your chance to catch design flaws, confusing questions, and procedural hiccups before you launch your full study.
Administer your draft assessment to a small, representative sample of your target population. Afterwards, gather their feedback. Did they find any questions confusing? Were the instructions clear? Was the timing right? Use this information to refine your tool. This process helps you identify and fix problems that could have seriously undermined your test and retest reliability down the line.
To see how these principles are applied in cutting-edge cognitive tools built for maximum reliability, visit the Orange Neurosciences website or contact our team for a personalized consultation to see our platform in action.
Frequently Asked Questions About Reliability
When you start digging into test and retest reliability, a few questions almost always pop up. Let's walk through the most common ones to clear things up and give you some practical guidance.
What Is a Good Reliability Score?
This is the million-dollar question, and the real answer is: it depends on the stakes. People often throw around 0.80 as a solid benchmark, but context is king. For a low-stakes internal survey about team morale, a score of 0.70 might be perfectly fine. No big deal.
But if we're talking about a high-stakes clinical assessment that will inform a diagnosis or a treatment plan? You need to aim much, much higher—ideally above 0.90. A higher score means less measurement error is muddying the waters, which gives you more confidence in the results for that one individual. The best way to decide is to ask yourself, "What decision will this score influence?"
How Do I Choose the Right Time Interval?
Picking the time between your test and retest is a bit of a balancing act. You're trying to land in a sweet spot that dodges two common problems:
Practice Effects: If the gap is too short, say just a day or two, people might just remember their answers from last time. This can artificially pump up the reliability score, making your test look more consistent than it actually is.
True Change: On the other hand, if you wait too long—maybe six months—the person might have genuinely changed. A lower score in this case doesn't mean your test is flawed; it means the person is different.
Actionable Insight: For stable traits like personality, a few weeks is usually a good bet. For something that fluctuates more, like a person's mood, a shorter window of a few days might make more sense.
What Is the Difference Between Reliability and Validity?
This one's a classic, and it's absolutely critical to understand. The easiest way to think about it is with an archery target.
Reliability is consistency. A reliable archer's arrows all hit the target in a tight little cluster. Validity is accuracy. A valid archer’s arrows hit the bullseye.
You can have one without the other. Practical Example: An archer could be incredibly reliable, hitting the exact same spot in the top-left corner every single time. Their shots are consistent (reliable), but they aren't hitting what they're aiming for (invalid). A test can do the same thing—consistently measure the wrong thing.
Ultimately, a great assessment needs both. It must give you consistent measurements (high test and retest reliability) and it must actually measure what it claims to (high validity).
Ready to see how these principles are applied in cutting-edge cognitive tools? The assessments from Orange Neurosciences are built from the ground up for both consistency and accuracy, delivering data you can genuinely trust.
Explore our platform to learn more about our cognitive assessment tools.

Orange Neurosciences' Cognitive Skills Assessments (CSA) are intended as an aid for assessing the cognitive well-being of an individual. In a clinical setting, the CSA results (when interpreted by a qualified healthcare provider) may be used as an aid in determining whether further cognitive evaluation is needed. Orange Neurosciences' brain training programs are designed to promote and encourage overall cognitive health. Orange Neurosciences does not offer any medical diagnosis or treatment of any medical disease or condition. Orange Neurosciences products may also be used for research purposes for any range of cognition-related assessments. If used for research purposes, all use of the product must comply with the appropriate human subjects' procedures as they exist within the researcher's institution and will be the researcher's responsibility. All such human subject protections shall be under the provisions of all applicable sections of the Code of Federal Regulations.


© 2026 by Orange Neurosciences Corporation