Human reaction time: Boost Performance with Faster, Safer Responses
Dec 18, 2025

Human reaction time measures the gap between noticing a cue and acting on it. It’s amazing how mere milliseconds can tip the scales—preventing a crash or delivering a perfect dive. Below, we’ll explore why simple and choice reaction times differ, and how that knowledge shapes training in both driving and sport.
Practical example: Try a stopwatch test—have a partner drop a ruler and catch it as quickly as possible. Record the distance it falls to estimate your simple reaction time.
Comparing Simple And Choice Reaction Time
Simple reaction time centres on one clear signal and one immediate response. Imagine a sprinter at the start line: the gun fires, and they’re off in about 200 ms.
Choice reaction time adds a decision layer. On the road, you see brake lights and must decide whether to slow down or steer around an obstacle. That split-second deliberation tacks on roughly 100 ms, which at 50 km/h translates to an extra 15 metres travelled before you hit the brakes.
Actionable insight: Set up two light switches and three buttons. Randomly light one switch and respond by pressing the matching button. Track your times to pinpoint decision-lag.
Simple Reaction Time: One signal, one response
Choice Reaction Time: Multiple signals, decision-making required
Why These Differences Matter
Choice-based tasks mirror everyday challenges—dodging a pedestrian, adjusting to a sudden pass in football, or responding to changing signals on the racetrack. Yet simple drills remain essential for boosting your baseline speed.
Summary Of Reaction Time Types
Type | Definition | Average Value | Application |
|---|---|---|---|
Simple Reaction Time | One stimulus triggers one response | 180–200 ms | Sprint start |
Choice Reaction Time | Multiple stimuli require a decision | 250–300 ms | Driving scenarios |
Understanding your reaction profile guides where to focus your training—whether that’s refining raw speed or sharpening split-second decisions. Platforms like Orange Neurosciences can help streamline assessment and track your progress with expert-backed tools.
Understanding The Neurological Process
When a stimulus appears, it races along our neural highways, but even tiny pauses add up. Picture brake lights flashing—your eyes register the warning, then that signal zips through the nervous system toward your muscles.
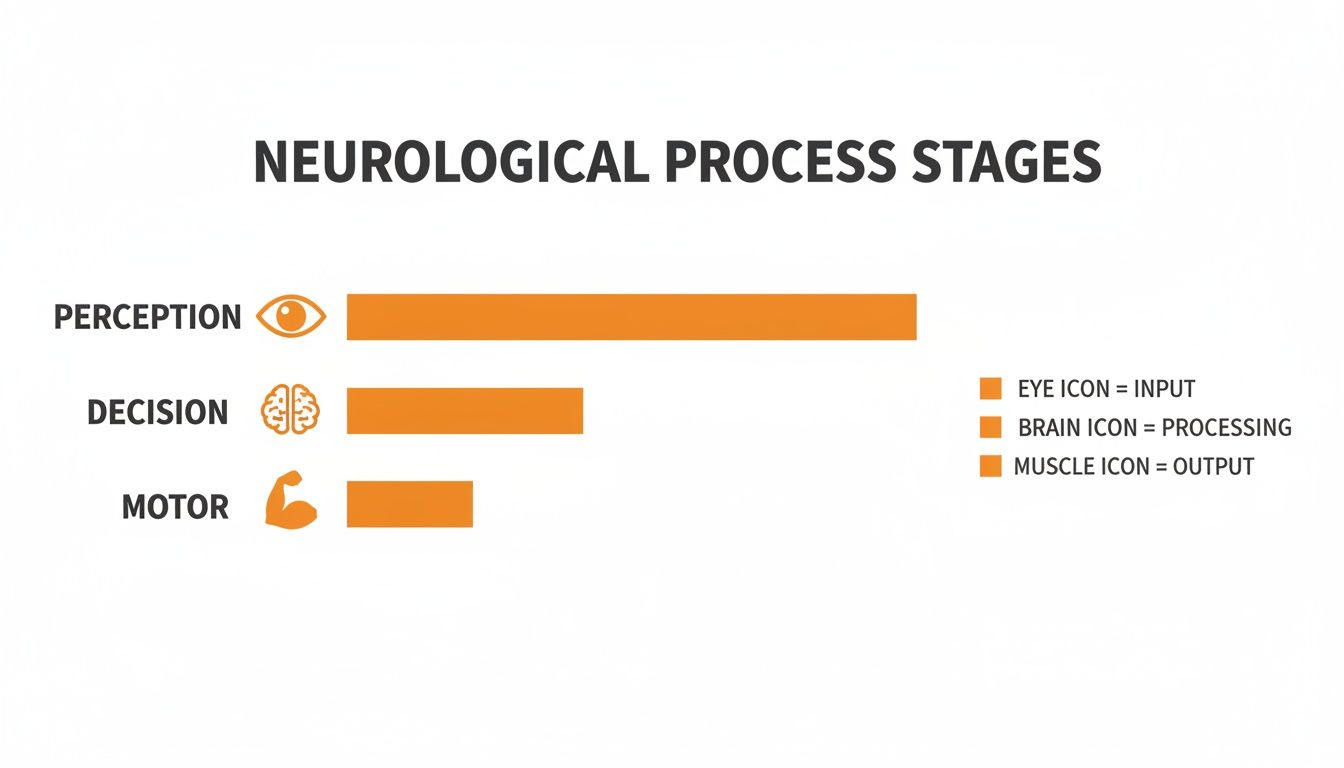
We can break reaction time into three stages: perception, decision and motor response. Each stage tacks on milliseconds that can mean the difference between a safe stop and a costly crash.
Practical example: Use a simple LED cue and record your own perception time by syncing a high-speed camera with a stopwatch, then compare with motor output delay.
Stages And Key Metrics
Stage | Average Time | Notes |
|---|---|---|
Perception | 200 ms | Detecting visual cues; can improve with attention and training |
Decision | 50–150 ms | Simple vs. complex tasks influence cognitive load |
Motor Response | 80–100 ms | Converting decisions into muscle action |
Key takeaways:
Perception: ~200 ms, can shrink with focused attention drills.
Decision: ~50–150 ms, trainable via choice-based exercises.
Motor Response: ~80–100 ms, enhanced with strength and coordination routines.
Altogether, you’re looking at 330–450 ms from stimulus to action in controlled experiments.
Relatable Driving Example
Cruising at 100 km/h, a deer darts into view. At 55 mph, that sequence can stretch to 1.75 seconds, covering roughly 142 feet before any slowing begins. This stop–start distance highlights why we study reaction time so closely in traffic safety research. For historical context, California’s early crash data collection (starting in 1928) helped standardize reaction time estimates during a registration boom—from 44,120 to 583,623 vehicles between 1910 and 1920.
Read the full findings on traffic safety evolution
Contextual Factors That Shift Performance
Variables that speed up or slow down responses include:
Age: Younger drivers outpace older ones with faster neural conduction.
Fatigue: Adds 20–30% to reaction intervals.
Distractions: A glance at your phone can double response time.
Environment: Poor lighting or noise disrupt initial detection.
Actionable tip: Before your next reaction test, record ambient light levels and noise. Correlate your times to identify real-world performance shifts.
Why This Foundation Matters
Grasping these neurological phases sets the stage for choosing the right measurement tools and protocols—beyond just “go/no-go” tasks. In concussion screening, separating decision lag from motor slowness shapes rehabilitation plans. Educators can tailor drills that sharpen specific skills.
Check out our guide on brain lobes functions
Measuring And Benchmarking Reaction Time
Understanding reaction time starts with recognising how quickly the brain detects a signal and triggers a response. Whether you’re screening athletes, assessing patients or running a research study, precise timing is non-negotiable.
Practical example: Use a tablet app for a visual cue task in your gym. Compare these results with a lab-grade system to estimate your measurement error.
Visual Reaction Tests: Sudden LED flash cues a button press.
Auditory Stimuli: Beeps or tones at various frequencies.
Tactile Feedback: A vibration on a handheld device.
Stopwatch Protocols: Low-tech approach with some manual error.
Lab Versus Field Methods
Best Practices for Reliable Data:
Calibrate devices against a known time standard.
Standardise posture and distance from screens.
Run multiple trials and filter outliers beyond two standard deviations.
Log environmental factors—light, noise and time of day.
Interpreting Latency And Variability
Latency is your average delay; variability measures consistency. Track error rates to catch false starts or anticipations.
Key Insight: Excluding a single outlier can improve your mean reaction time by over 5%.
Visual, Auditory Versus Tactile Tests
Visual tasks often clock in slower. An auditory cue (horn honk) trims roughly 30 ms, while a tactile vibration cuts another 20 ms. This is why tactile drills are common in sports.
Normative Benchmarks By Age
Reaction Time Norms By Age Group
Age Group | Simple RT (ms) | Choice RT (ms) |
|---|---|---|
18–29 | 250 | 350 |
30–39 | 260 | 360 |
40–59 | 280 | 380 |
60+ | 300 | 400 |
For detailed testing protocols you can implement today, see our guide on cognitive tests online. To simplify data collection and track results over time, visit Orange Neurosciences.
Factors Affecting Reaction Time
Your reaction time reflects muscle speed and neural processing harmony. Key factors include:
10–20 ms added per decade from nerve conduction changes
20–30% longer responses when fatigued
Decision time doubling under multitasking
Slower responses after alcohol or medication
Age And Fatigue Impacts
By age 60, simple times hover around 300–320 ms, versus 250 ms in younger adults. Sleep deprivation can push times to 350 ms after 24 hours awake.
Expert Insight
When age and fatigue collide, reaction times can slip past safe thresholds—especially in high-stakes environments.
Distractions And Substance Use
A glance at your phone doubles response times. California reports around 1,500 daily marijuana-related accidents—mirroring a 1¾-second perception time at 55 mph (covering 142 feet).
Actionable tips:
Get 7–9 hours of sleep nightly.
Minimise distractions with quiet rooms or noise-cancelling setups.
Schedule tests away from peak medication times.
Adjust lighting to mirror real-world conditions.
Designing Fair Assessments And Interventions
Tailor protocols for different groups: older adults, shift workers or athletes—each has unique needs. Check Learn more about concussion impacts to see how metrics inform recovery. For tailored assessments and dashboards, contact us at hello@orangeneurosciences.ca.
Implementing Reaction Time Assessments
Gather precise reaction time data with a clear protocol in clinics, schools or sports facilities.
Preparation Checklist
Computer or tablet with validated software
High-refresh-rate display
Tactile response pad or button box
Quiet, well-lit testing area
Calibration gear (photodiode or audio calibrator)
Software Configuration
Select visual, auditory or tactile stimuli
Include a practice block of 5–10 trials
Randomise inter-stimulus intervals (500–1500 ms)
Plan for 20–30 trials per condition
Enable automatic CSV export
Learn more: Orange Neurosciences Cognitive Assessments
Validating Equipment
Run a 100-trial calibration with a photodiode
Measure response pad lag
Cross-check results against specs
Participant Briefing
Explain the goal: measure response speed.
Demonstrate posture: fingers on pad, eyes on screen.
Run one practice trial.
Emphasise react, don’t guess.
Customising Tests
Children: sessions under 15 minutes, playful graphics.
Older Adults: enlarge stimuli, slow intervals.
Elite Athletes: add choice tasks and unexpected cues.
Scoring And Interpretation
Report Item | Description |
|---|---|
Mean Reaction Time | Average delay across trials |
Variability | Consistency by standard deviation |
Percentile Rank | Relative to age-matched peers |
Trimming 50 ms off choice RT reduces stopping distance by 4 metres at 80 km/h.
Integrating CDL Metrics
California’s CDL Handbook notes a 1⅞-second perception time at 55 mph (142 feet before braking). For more, see: https://ledgerlaw.com/how-many-car-accidents-happen-per-day-in-california/
Follow-Up Recommendations
Drills: haptic exercises, dual-task challenges.
Referrals: neurofeedback or physiotherapy.
Reassessment: in 4–6 weeks.
Real-World Case Studies
Youth soccer team shaved 30 ms off choice RT, boosting interceptions.
Driving school cut simulated braking distance by 5 feet on average.
Ready to optimise your assessment workflow? Reach out at hello@orangeneurosciences.ca for custom setup guidance today.
Training And Improving Reaction Time
Improving reaction time takes dedication. Dual-task drills and neuromuscular routines lay the groundwork for faster responses.
Sample Weekly Routine
Monday Cognitive Circuit: Catch a tennis ball while naming world capitals.
Wednesday Video-Game Session: 10 minutes on a random-target app.
Friday Neuromuscular Drills: Plyometric jumps and resistance band shuffles (3×12).
“Consistent mixed drills train both brain and body for split-second decisions.”
Good sleep (7–8 hours) and protein-rich meals cement gains.
Progress Tracking And Technology
Log your times biweekly to spot trends. Monitor both average RT and variability. Learn more about eye–hand coordination exercises.
Clinical Applications
Balance Platform Drills: shift weight to random lights.
Mirror Feedback: mirror limb movements to haptic prompts.
VR Tasks: driving simulations with quick steering cues.
Platforms like Orange Neurosciences streamline assessment and tracking.
FAQ
Checking your reaction time isn’t a one-and-done deal. Retest every 4–6 weeks at the same time for consistency. Dim lighting can slow visual detection by 15%, and noise can add 20 ms to auditory trials.
Maintain lighting at 300–500 lux.
Use a quiet room or noise-cancelling headphones.
Log ambient conditions for context.
“Small environment changes can shift reaction times by tens of milliseconds.”
Professional Involvement And Training
Consult an expert if your times sit >2 standard deviations outside the norm or fluctuate wildly. Beginners often shave 10–20 ms in six weeks; seasoned athletes may need 3–4 months. A recreational driver cut choice RT from 300 ms to 270 ms in eight weeks by blending tactile drills with cognitive apps.
If you suspect post-concussion delays, book a neuropsychological assessment.
Ready to streamline assessments and track your human reaction time progress? Get started with Orange Neurosciences or email us at hello@orangeneurosciences.ca.

Orange Neurosciences' Cognitive Skills Assessments (CSA) are intended as an aid for assessing the cognitive well-being of an individual. In a clinical setting, the CSA results (when interpreted by a qualified healthcare provider) may be used as an aid in determining whether further cognitive evaluation is needed. Orange Neurosciences' brain training programs are designed to promote and encourage overall cognitive health. Orange Neurosciences does not offer any medical diagnosis or treatment of any medical disease or condition. Orange Neurosciences products may also be used for research purposes for any range of cognition-related assessments. If used for research purposes, all use of the product must comply with the appropriate human subjects' procedures as they exist within the researcher's institution and will be the researcher's responsibility. All such human subject protections shall be under the provisions of all applicable sections of the Code of Federal Regulations.


© 2026 by Orange Neurosciences Corporation