Reliability Test Retest: A Practical Guide for Cognitive Assessments
Dec 29, 2025

When we talk about test–retest reliability, we're really just asking a simple question: if we run the same test on the same person twice, will we get a similar result? Think of it as a measure of a test's stability over time. At its core, it's about ensuring that if nothing has changed with the individual, their score shouldn't dramatically change either.
A high correlation between the first and second scores is the hallmark of strong test–retest reliability.
What Is Test–Retest Reliability and Why Does It Matter?
Imagine you’re trying to track your weight. You step on your bathroom scale, check the number, step off, and then immediately step back on. You’d expect it to show the exact same weight, right? If it reads 150 pounds one second and 165 the next, you’d know something is wrong with the scale. You certainly wouldn't trust it to tell you if your new diet and exercise plan is working.
That’s the essence of test–retest reliability in cognitive assessment. It’s the degree to which a tool gives you stable, consistent results over multiple tries, assuming the cognitive function being measured hasn't actually changed. Without it, a cognitive test is just like that faulty scale—unreliable and ultimately useless for making any meaningful decisions.
The Cornerstone of Trustworthy Measurement
In both clinical and research settings, consistency is everything. Any change in a patient’s score has to reflect a genuine shift in their cognitive abilities, not just a random wobble from the test itself. This becomes absolutely critical when those scores inform decisions about care, treatment plans, or interventions.
Consider just a few real-world scenarios where test–retest reliability is a must-have:
Tracking Recovery: A neurologist monitoring a patient's recovery after a concussion needs to be sure that an improvement in their memory score is real progress, not just measurement error.
Evaluating Interventions: Researchers testing a new cognitive training program have to be confident that score changes are because the program works, not because the test is inconsistent.
Long-Term Monitoring: Families and caregivers using platforms like Orange Neurosciences depend on consistent data to track cognitive health over months or years, giving them peace of mind and clear insights.
Before we dive deeper, let's quickly break down the fundamental concepts of reliability. This table serves as a quick reference guide to help you build a solid foundation.
Key Reliability Concepts at a Glance
Concept | Simple Analogy | Why It Matters in Cognitive Testing |
|---|---|---|
Reliability | A trustworthy bathroom scale that gives you the same weight if you step on it twice in a row. | Ensures that a change in score reflects a true change in the person's ability, not a flaw in the test. |
Test–Retest Reliability | Checking that same scale on Monday and again on Tuesday (assuming you haven't changed your diet). | Confirms the test is stable over time, which is crucial for tracking progress or decline. |
Measurement Error | The random fluctuations on the scale—sometimes it's up a pound, sometimes down, for no reason. | This is the "noise" in the data. High reliability means low measurement error. |
True Score vs. Observed Score | Your actual weight vs. the number the scale shows you (which includes that random error). | We can never know the "true score," but a reliable test gives us an observed score that's very close to it. |
Understanding these basics is key. High reliability gives clinicians and researchers confidence that they can distinguish a real change from statistical noise—a vital step in providing effective care. To learn more about the foundational concepts of cognitive testing, you can check out our guide on what is cognitive assessment.
A reliable test acts as a dependable anchor. It ensures that when we measure cognitive function today and again next month, we're measuring the person, not the unpredictability of the tool.
Ultimately, strong test–retest reliability is what makes the data dependable. It builds the foundation of trust we need to make informed decisions, whether that means adjusting a rehabilitation plan, validating a new therapy, or simply understanding an individual's cognitive journey with much greater clarity.
Decoding the Core Statistical Measures
Statistics can feel like a foreign language, but when it comes to reliability, they’re your best translator. They take abstract ideas like "consistency" and turn them into concrete numbers you can actually work with. Let's break down the essential statistical measures you'll need for a reliability test retest study, making them clear and practical.
First, it helps to see how reliability, consistency, and trust are all woven together in cognitive assessments.
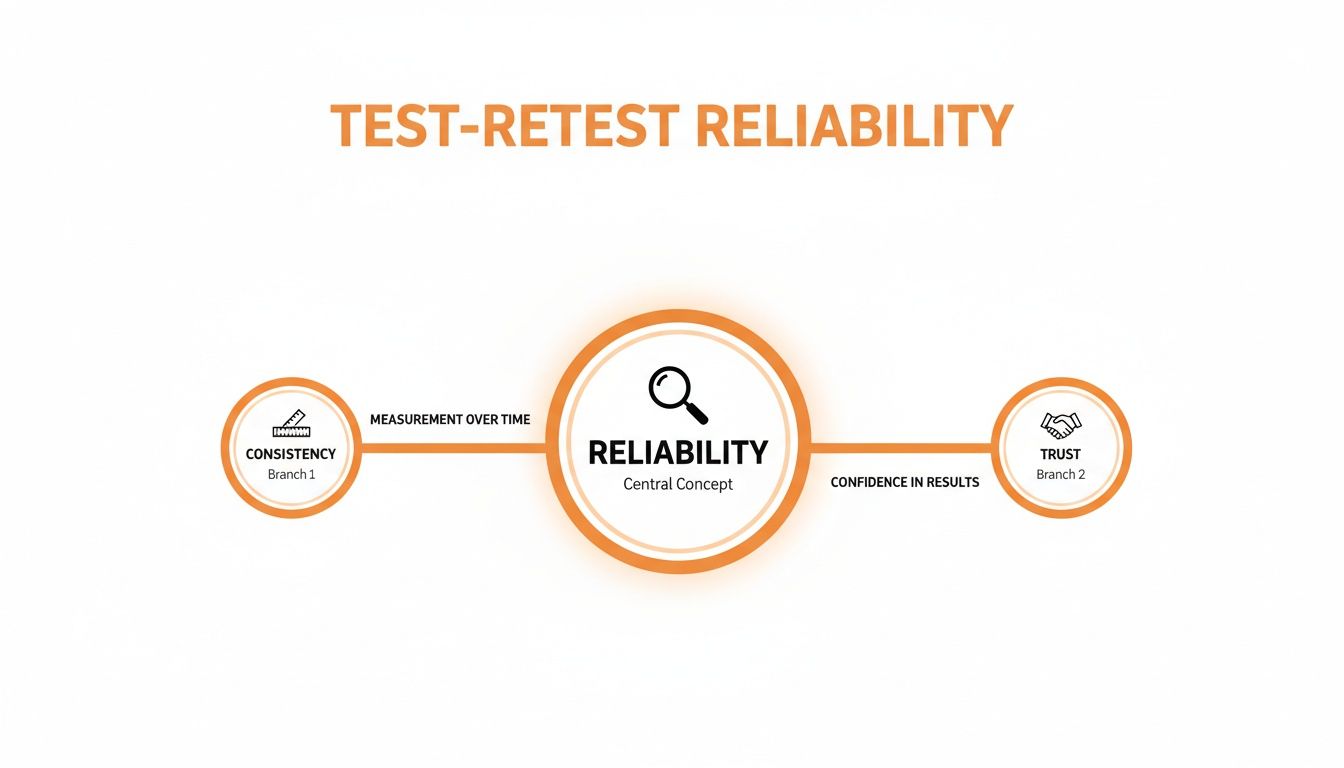
This map shows that genuine reliability stands on two pillars: a consistent measurement tool and the trust that this consistency builds in clinicians and researchers.
Correlation Is Not Enough
Many studies kick off with simple correlation coefficients like Pearson's r or Speman's rho. These stats tell you if two sets of scores tend to move in the same direction. So, if people who scored high on the first test also scored high on the second, you’d get a strong positive correlation.
But here’s the catch: correlation only shows you the strength of a relationship, not true agreement between scores.
Practical Example: Imagine a cognitive test where every single participant scores exactly 10 points higher on the retest. This would give you a perfect Pearson's correlation of r = 1.0, making it look flawlessly reliable. The problem is, there’s a systematic error at play—the test isn't giving the same score, just a predictably higher one. This is exactly why correlation is just a starting point, not the final word.
ICC: The Gold Standard for Reliability
This is where the Intraclass Correlation Coefficient (ICC) comes in. It’s widely considered the gold standard for test-retest reliability because it measures both the relationship and the agreement between scores. Unlike Pearson's r, the ICC accounts for systematic errors, giving you a much truer picture of a test's consistency.
There are several forms of the ICC, and the one you choose depends on your study's design. An ICC value always falls between 0 and 1, where a score closer to 1 signals higher reliability.
As a rule of thumb, an ICC above 0.75 is considered good, while anything above 0.90 is excellent, especially for clinical tools. For a deeper look into the specifics, our guide on test-retest reliability statistics breaks down the calculations in more detail.
From Numbers to Clinical Action
While the ICC gives you the big picture of a test's reliability across a group, other stats help translate this into meaningful results for an individual. Two of the most important are the Standard Error of Measurement (SEM) and the Minimal Detectable Change (MDC).
Standard Error of Measurement (SEM): Think of the SEM as the margin of error for any single score. No test is perfect; there’s always some measurement "noise." The SEM quantifies this noise in the original units of the test (like points on a scale).
Minimal Detectable Change (MDC): This is the smallest change in a score that you can confidently say is real and not just due to that random error (the SEM). It's calculated using the SEM and gives you a practical threshold for determining clinical significance.
Actionable Insight: Let's say a patient's score on a memory test improves by five points after a new therapy. Is this a genuine improvement? If the test’s MDC is eight points, that five-point change is likely just statistical noise. But if the MDC is three points, you can be much more confident that the patient has truly improved.
Visualizing Agreement with Bland-Altman Plots
Finally, a Bland-Altman plot offers a powerful visual that numbers alone can't provide. This chart plots the difference between the two test scores against their average, letting you spot patterns of disagreement that might otherwise fly under the radar.
For instance, you might discover that a test consistently overestimates scores at the low end but underestimates them at the high end. This kind of bias is critical to find and is nearly impossible to see with just a single reliability coefficient.
When evaluating a test's diagnostic accuracy, it’s also vital to understand measures like sensitivity and specificity. These complement reliability by telling you how well a test identifies true positives and negatives. Mastering these statistical tools moves you beyond simply collecting data to making confident, evidence-based decisions in your clinical practice or research.
How to Design a Robust Reliability Study
Getting strong reliability data doesn't happen by accident; it's the result of a meticulously planned and executed study. Designing a solid reliability test retest study means making a series of smart decisions that directly shape the quality of your results. Think of this as your practical playbook for creating a high-quality study that delivers meaningful, dependable data.
The first move is shifting from an abstract idea to a concrete plan, which hinges on a few key considerations that will form the backbone of your research.

Determining Your Sample Size
One of the first questions you'll hit is, "How many participants do I actually need?" While there's no single magic number, the sweet spot is recruiting enough people to make your results stable and generalizable, but not so many that the study becomes a logistical nightmare.
For most test-retest reliability studies, a sample size of 30 to 50 participants is a great starting point. This range is usually big enough to give you a stable estimate of the Intraclass Correlation Coefficient (ICC) without being overwhelming.
Of course, the ideal number really depends on things like how much variability you expect in your population and how precise you need your results to be. It’s always a good idea to run a power analysis to get a more tailored estimate for your specific cognitive assessment. Our guide to cognitive assessment online dives into more of these practical considerations.
Selecting the Retest Interval
Picking the right time gap between the first and second test is a bit of a balancing act. You need the interval to be just right to sidestep two common issues.
Practical Example: If you administer a verbal memory test on Monday and again on Tuesday, participants might simply recall the word list from the day before, inflating their second score. This is a classic memory effect.
But if you wait too long, you risk measuring real changes in your participants' cognitive abilities instead of just the stability of your test. A two-week interval is a popular and effective choice for many cognitive assessments. It's long enough to minimize memory effects but short enough that significant cognitive shifts are unlikely.
Controlling for Practice and Fatigue Effects
When people take the same test more than once, their performance can be swayed by things other than their true cognitive ability. Two of the biggest culprits are practice effects and fatigue effects.
Practice Effects: This is when someone scores better the second time around simply because they’re more familiar with the test format and questions.
Fatigue Effects: On the flip side, someone might do worse on the retest if they’re bored, tired, or just less motivated than they were the first time.
You can use a few strategies to keep these influences in check. One great method is to counterbalance the test forms. If you have two equivalent versions of a test (let’s call them Form A and Form B), have half your participants take A then B, and the other half take B then A. This helps average out any systematic differences between the two forms.
Another tactic is to include a short, standardized warm-up or practice session before each test. This gets everyone on a similar footing of familiarity, dialing back the advantage gained from the first session. Clear instructions and a consistent testing environment are also absolutely crucial for clean, trustworthy data.
For a great real-world example, look at a study that validated the California Cognitive Assessment Battery (CCAB) for remote use with older adults. It involved 415 participants and showed excellent average test-retest reliabilities (r=0.83). The feasibility was fantastic, with 99.7% of participants completing three days of at-home testing. This proves that a well-designed protocol can achieve high compliance and produce robust data, even in a remote setting. You can discover more about these findings on Frontiers in Human Neuroscience.
By thoughtfully planning your sample size, retest intervals, and potential confounding variables, you can design a study that produces clear, trustworthy results. This evidence-first approach is exactly how we build reliable cognitive tools on the Orange Neurosciences platform.
Interpreting Your Results: What the Numbers Really Mean
You’ve designed your study, collected the data, and now you’re staring at a spreadsheet full of numbers. This is where the magic happens—turning those statistical outputs into real, actionable insights that can genuinely guide patient care. The numbers tell a story, but only if you know their language.
First things first, look at your Intraclass Correlation Coefficient (ICC). This single number is a powerful snapshot of your test's consistency. While there are no universal, set-in-stone rules, some benchmarks are widely accepted across clinical and research fields.
Generally, an ICC value above 0.90 is considered excellent. This signals that your assessment has very low measurement error and can be trusted to track an individual's progress over time. For high-stakes clinical decisions, this is the gold standard.
Interpreting Intraclass Correlation (ICC) Values
To make this easier, here's a quick reference guide for understanding what different ICC values mean in a practical sense.
ICC Value Range | Level of Reliability | Actionable Interpretation & Use Case |
|---|---|---|
Below 0.50 | Poor | Unsuitable for any clinical use. Avoid this tool as measurement error is too high. |
0.50 – 0.75 | Moderate | May be acceptable for group-level research, but avoid using it to track individual patient progress. |
0.75 – 0.90 | Good | Reliable enough for most clinical applications. You can use it to track changes in individual patients. |
Above 0.90 | Excellent | The gold standard. Use this for high-stakes decisions like diagnosis or medication adjustments where precision is critical. |
Think of these values as a compass, not a rigid map. The right level of reliability always depends on the specific situation.
Beyond the Benchmarks: Context Is Everything
A number on its own is meaningless without context. The level of reliability you need hinges entirely on why you're using the test. A tool designed for large-scale research might be perfectly fine with an ICC of 0.75. But that same value would be totally inadequate for a test used to diagnose a progressive neurological condition.
Practical Example: A screening tool to identify at-risk students in a school district could be useful with an ICC of 0.80. However, a test used to determine if a surgeon is cognitively fit to return to the operating room after an illness would demand an ICC of 0.95 or higher.
For instance, the Cognitive Assessment Interview (CAI) has shown great test-retest reliability for evaluating functional cognition. Over a one-month period, studies found ICCs between 0.79 to 0.84, establishing it as a strong tool for connecting subjective patient reports with objective cognitive changes. You can read the full research on its validation here. That level of reliability is spot-on for its intended purpose.

A Practical Case Study: Tracking Concussion Recovery
Let's walk through a real-world example. Imagine a patient, Alex, who is recovering from a concussion. You’re using an Orange Neurosciences assessment to monitor their executive function.
Baseline Score (Week 1): Alex scores 45.
Follow-up Score (Week 3): Alex scores 52.
That seven-point jump looks promising. But is it a true improvement, or could it just be a random fluctuation? This is where the Standard Error of Measurement (SEM) and Minimal Detectable Change (MDC) become your most valuable clinical tools.
Let’s say the reliability study for this particular assessment found an SEM of 3 points and an MDC of 8 points.
Interpret the SEM: The SEM of 3 tells you that Alex's "true" score is likely within 3 points (plus or minus) of what was measured. So, that week 3 score of 52 really represents a true score somewhere between 49 and 55.
Apply the MDC: The MDC of 8 is the key. It's the smallest change that you can be 95% confident is real and not just statistical noise.
Since Alex’s score only improved by seven points—which is less than the MDC of eight—you can’t confidently say a genuine cognitive improvement has happened. The change is still within the test's margin of error.
This insight is crucial. Instead of telling Alex they've definitely improved, you can give them a more honest and accurate interpretation: their score is holding steady but hasn't shown a statistically significant change just yet. Our guide on MMSE scoring and interpretation explores how these principles apply to other well-known assessments.
Using SEM and MDC moves you beyond guesswork. It empowers you to make evidence-based judgments and give patients clearer, more transparent feedback on their progress.
Putting Reliability into Clinical Practice
It’s one thing to understand the theory behind test–retest reliability, but it’s another thing entirely to apply it confidently in a busy clinic or research setting. This is where we bridge the gap between abstract stats and concrete action. The real goal is to turn reliability into a practical tool that sharpens your decisions, improves how you talk to patients, and ultimately strengthens the quality of your work.
Whether you're a researcher reporting your findings or a clinician sizing up a new assessment, the core principles are the same. It all starts with knowing what to look for and how to explain it.
How to Critically Evaluate a Test Provider
When you’re looking at a new cognitive assessment tool, don't just take a company’s claim of “high reliability” at face value. You’ve got to dig a little deeper to make sure the tool is actually right for your specific needs. Think of it as a checklist to verify the real quality behind their numbers.
Here are the key questions you should be asking any test provider:
Who was in the study? A test that’s reliable for healthy university students might not be for older adults with mild cognitive impairment. The study population has to match your clinical population.
What was the retest interval? Look for an interval that makes clinical sense—usually somewhere between two and four weeks. This is the sweet spot that minimizes practice effects without being so long that real cognitive changes could have happened.
Which stats are they showing you? A simple Pearson’s r just doesn’t cut it. You should demand the gold standard: the Intraclass Correlation Coefficient (ICC), backed up by the Standard Error of Measurement (SEM) and Minimal Detectable Change (MDC).
What were the actual ICC values? For clinical decision-making, you should be looking for ICC values of 0.80 or higher. For high-stakes assessments, that number should ideally be pushing above 0.90.
This kind of critical evaluation is a cornerstone of our work at Orange Neurosciences. We believe in total transparency, making sure the reliability data for our tools is both robust and genuinely relevant to the people they’re designed to help.
Communicating Results to Patients and Families
One of the most important—and often overlooked—skills is explaining measurement error to patients and their families. When a score goes up or down, it can spark unnecessary anxiety or false hope. Your job is to provide clear, calm context.
Imagine explaining a small dip in a patient’s memory score. You could put it this way:
“Think of this test like a bathroom scale. Your weight can bounce around a little bit day to day for all sorts of reasons, even if your true weight hasn't changed. This test is a lot like that. Your score moved a little, but it’s still well within the test's normal margin of error, which tells us things are holding steady.”
This simple analogy takes the mystery out of the numbers and helps everyone manage their expectations. And by using the MDC, you have a clear, evidence-based line in the sand for when you can confidently tell a family that a change in score reflects a real clinical shift.
An Actionable Checklist for Reporting Your Findings
For researchers, reporting your reliability findings with clarity and transparency is absolutely vital for building trust in your work. Think of your methods section as a clear recipe that anyone can follow.
Here’s a simple checklist for transparent reporting:
Participant Demographics: Clearly describe your sample (age, gender, clinical status).
Test Procedures: Detail the testing environment and the instructions you gave.
Retest Interval: State the exact time between tests (e.g., “a mean of 14 days, with a range of 12–16 days”).
Statistical Methods: Be specific about the exact ICC model you used (e.g., ICC(2,1), two-way random effects, absolute agreement).
Report Key Metrics: Always report the ICC, its 95% confidence interval, the SEM, and the MDC.
Long-term studies can offer powerful insights into a test's stability over time. For instance, a landmark study on the California Verbal Learning Test (CVLT-2) followed healthy older adults for up to four years. Their findings showed that reliability remained moderate, and critically, 88-97% of participants showed stable performance within a 90% confidence interval. This confirmed the test behaves as expected over the long haul. You can learn more about these long-term reliability findings.
These principles of rigorous validation and transparent reporting are woven into everything we do. To see these high standards in action, you can explore our suite of cognitive assessment tools and discover how we deliver psychometric excellence and data you can truly depend on.
Test-Retest Reliability: Your Questions Answered
When you get into the nitty-gritty of test-retest reliability, a few practical questions always come up. Let’s tackle some of the most common ones so you can apply these concepts with more confidence in your clinical or research work.
How Long Should I Wait Between Tests?
Picking the right time gap between the first test and the retest is a real balancing act. You’re trying to avoid two key problems.
Go too short, and people might just remember their answers from the first time. This is called the memory effect, and it can make a test look more reliable than it actually is by artificially pumping up the scores.
But if you wait too long, you might start measuring real changes in someone’s cognitive ability instead of just the test’s consistency. For most cognitive assessments, a window of two to four weeks hits the sweet spot. It's usually long enough for memory to fade but short enough that you wouldn't expect major cognitive shifts.
How Many People Do I Need for a Reliability Study?
There's no single magic number, but a solid rule of thumb for a test-retest reliability study is to aim for 30 to 50 participants. This sample size is usually big enough to get a stable, meaningful estimate of the Intraclass Correlation Coefficient (ICC).
A sample size in this range gives you enough statistical power to spot meaningful reliability scores without making your study a massive headache in terms of recruitment and cost.
Of course, the perfect number can shift. If you're working with a population that has a lot of variability or you need extremely precise results, you might need more people. For high-stakes clinical tools, it's always better to err on the side of a larger sample.
What’s the Difference Between Reliability and Validity?
People often mix up reliability and validity, but they answer two completely different—and equally critical—questions about a test's quality.
Reliability asks: "Is the test consistent?" It’s all about getting the same result over and over under the same conditions. Think repeatability.
Validity asks: "Is the test measuring what it’s supposed to measure?" This is about accuracy. A valid memory test actually measures memory, not just attention or how fast someone can process information.
Here’s a practical analogy: Imagine using an old rifle at a shooting range.
Reliable but Invalid: You hit the same spot in the top-left corner every time. The rifle is consistent (reliable), but it’s not accurate (invalid).
Valid but Unreliable: Your shots are scattered all over the target, but their average is right on the bullseye. The rifle is accurate on average (valid), but it's not consistent (unreliable).
Reliable and Valid: Every shot is a tight cluster right in the bullseye. This is the goal for any good assessment.
What If I Can’t Find Reliability Data for a Test?
This should be a major red flag. If a test provider doesn't openly share its test-retest reliability data, you have to wonder why. Any assessment tool worth its salt is built on a foundation of solid psychometric evidence, and that data should be easy for clinicians and researchers to find.
If you find yourself in this spot, here’s your action plan:
Ask for the Data Directly: Get in touch with the provider. Ask for their technical manual or any validation studies they've done. Be specific: you want to see the ICC values, the SEM, and the MDC.
Look for Independent Research: Check peer-reviewed journals to see if independent researchers have put the tool to the test. This can give you a much more objective view of its reliability.
Find a Better Alternative: If the provider won't share the data or what they have is weak, your best move is to find another assessment tool with a proven track record of strong psychometric properties.
Making clinical judgments or research conclusions with a tool of unknown reliability is like trying to navigate a new city without a map. You're introducing a level of uncertainty that simply isn't acceptable.
At Orange Neurosciences, we are committed to building our tools on a solid foundation of psychometric evidence. We believe in transparency and giving clinicians data they can absolutely trust. To see how our evidence-based approach can support your work, we invite you to explore our suite of cognitive assessment tools.
Discover reliable cognitive assessments at Orange Neurosciences

Orange Neurosciences' Cognitive Skills Assessments (CSA) are intended as an aid for assessing the cognitive well-being of an individual. In a clinical setting, the CSA results (when interpreted by a qualified healthcare provider) may be used as an aid in determining whether further cognitive evaluation is needed. Orange Neurosciences' brain training programs are designed to promote and encourage overall cognitive health. Orange Neurosciences does not offer any medical diagnosis or treatment of any medical disease or condition. Orange Neurosciences products may also be used for research purposes for any range of cognition-related assessments. If used for research purposes, all use of the product must comply with the appropriate human subjects' procedures as they exist within the researcher's institution and will be the researcher's responsibility. All such human subject protections shall be under the provisions of all applicable sections of the Code of Federal Regulations.


© 2026 by Orange Neurosciences Corporation